
Figures & data
Figure 1. Study area location (Data source: United States Census Bureau).
Table 1. Post-Katrina remote sensing datasets for the study area.
Figure 2. Debris zone and debris line extraction workflow.
Figure 3. Flowchart for debris zone extraction based on debris and non-debris classification result.
Figure 4. IKONOS data and classification results: (a) IKONOS-2 panchromatic image (Source: DigitalGlobe 2-Sep-05); (b) spectral only classification; (c) textural only classification; (d) spectral–textural classification (white = debris class, black = non-debris class).
Table 2. Case study operations and corresponding parameters for debris zone extraction based on imagery type and classification approach.
Figure 5. Debris zone results for IKONOS imagery based on classification approach: (a) spectral only; (b) textural only; (c) spectral–textural (white = debris class, black = non-debris class).
Figure 6. Debris line results for IKONOS imagery (Source: DigitalGlobe 2-Sep-05) based on classification approach: (a) spectral only; (b) textural only; (c) spectral–textural.
Figure 7. NOAA imagery and debris line results based on classification approach: (a) resampled NOAA photo (Source: NOAA 30-Aug-05); (b) spectral only; (c) textural only; (d) spectral–textural.
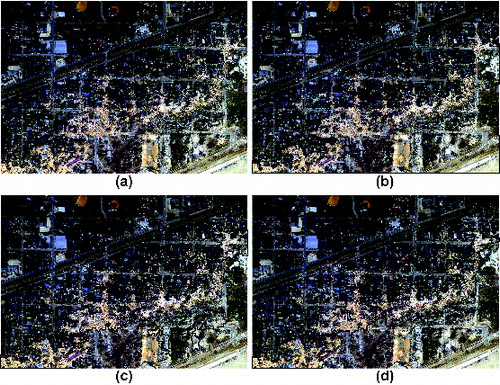
Figure 8. (a) Comparison of debris zone results obtained from spectral–textural classification approach for IKONOS and NOAA imagery (interior boundary = identified as debris from both data types; grey = identified as debris in IKONOS imagery but non-debris in NOAA imagery; black = identified as debris in NOAA imagery but non-debris in IKONOS imagery). (b) Extracted IKONOS spectral–textural classification debris line compared with manually interpreted results from Friedland et al. (Citation2011). Image source: DigitalGlobe 2-Sep-05.
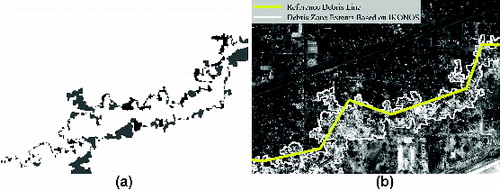
Table 3. Debris zone areas (measured in pixels) extracted using the three different classification methods for IKONOS and NOAA imagery.
Table 4. Approximate processing time for debris zone extraction based on classification approach for case study image.