
Figures & data
Figure 1. Location and elevation data of the study area.
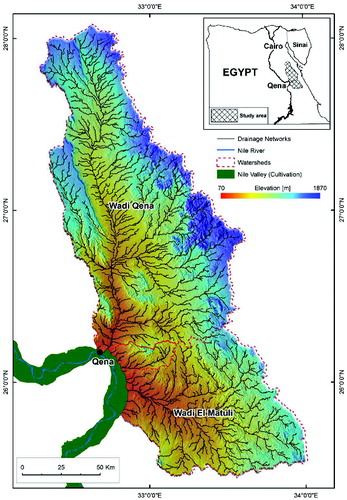
Figure 2. (a) Climograms show a combination of average monthly temperature and (b) total rainfall and length of the dry season after Walter-Leith.
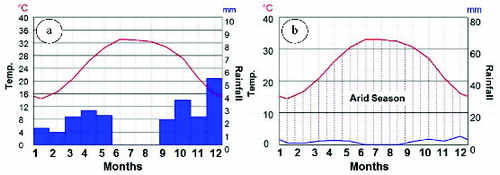
Table 1. Historical flash floods in Qena.
Figure 3. Study scheme (modified after Moawad Citation2013).
Table 2. Statistical analysis, estimated rainfall and model efficiency.
Figure 4. Daily development of storms over the Sahara from 23 to 28 January 2013.
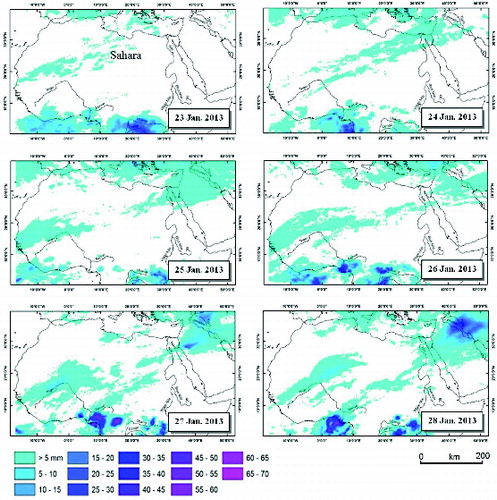
Figure 5. Infrared Eumetsat images show 6-hours development of the jet streams over the Sahara from 27 January 2012 (23:00 pm UTC) to 28 January 2013 (02:00 am UTC).
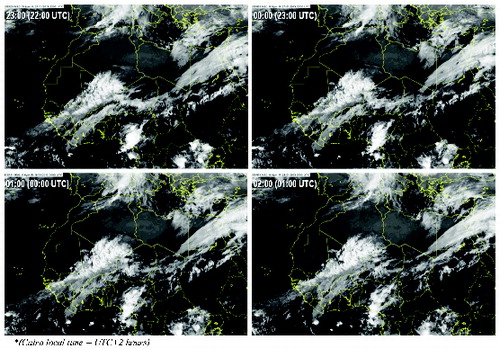
Figure 6. (a) Cumulative rainfall (Rcum) [mm] and (b) volume of rainfall (Rvol) [m3] from 23 to 30 January 2013.
![Figure 6. (a) Cumulative rainfall (Rcum) [mm] and (b) volume of rainfall (Rvol) [m3] from 23 to 30 January 2013.](/cms/asset/b1cb8bca-dd6e-464b-aaa0-8871c13b76ef/tgnh_a_885467_f0006_b.gif)
Figure 7. (a) Rain strength for 6 hours of storm duration and (b) actual rain strength for 2 hours of storm duration on 28 January 06:00 am [mm hr−1].
![Figure 7. (a) Rain strength for 6 hours of storm duration and (b) actual rain strength for 2 hours of storm duration on 28 January 06:00 am [mm hr−1].](/cms/asset/858a000e-94fd-4851-b2fc-10955230ed26/tgnh_a_885467_f0007_b.gif)
Figure 8. Hydrological soil groups (HSG), adjusted curve number (CN I) [unitless] and surface infiltration.
![Figure 8. Hydrological soil groups (HSG), adjusted curve number (CN I) [unitless] and surface infiltration.](/cms/asset/ebd3d622-d345-4d54-85da-8badab316dde/tgnh_a_885467_f0008_b.gif)
Table 3. Hydrological estimations.
Figure 9. (a) Estimated surface runoff (Qsur) [mm] and (b) runoff volume (Qvol) [m3].
![Figure 9. (a) Estimated surface runoff (Qsur) [mm] and (b) runoff volume (Qvol) [m3].](/cms/asset/c1640d96-d9ae-4ddf-8f65-1fdff0ec6393/tgnh_a_885467_f0009_oc.jpg)