Figures & data
Figure1. Location of the study area showing the natural and climate-induced disaster in the country.
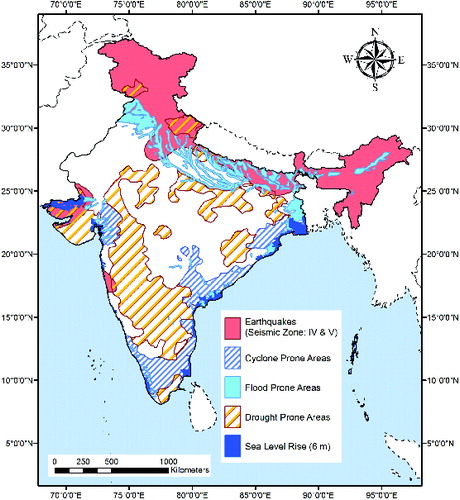
Table 1. Vulnerability indicators used in the study.
Table2. Pairwise comparison matrix using Saaty's scale of measurement (Saaty Citation2008).
Figure2. The sequential process in this study to map the disaster vulnerability.
Figure3. District-level mapping to disasters in India: (a) exposure, (b) sensitivity, and (c) adaptive capacity.
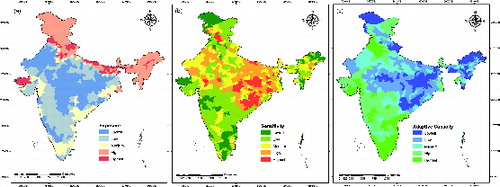
Table3. District-wise disaster vulnerability in India.
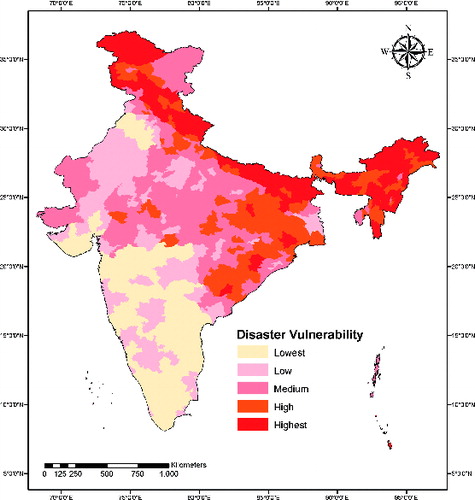
Figure4. District-level mapping of disaster vulnerability in India, measured as a composite of exposure, sensitivity, and adaptive capacity indices.