Figures & data
Figure 1. Study area.
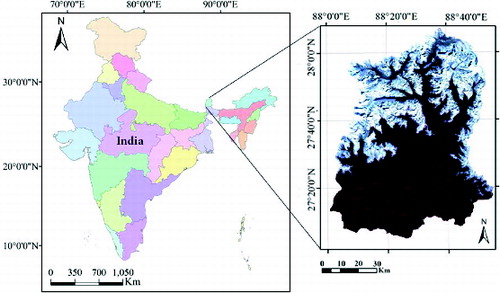
Figure 2. Work flow of the methodology of this study.
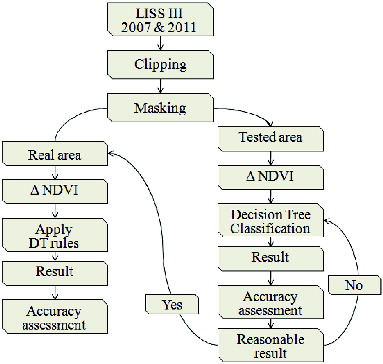
Figure 3. Tested and real study area.
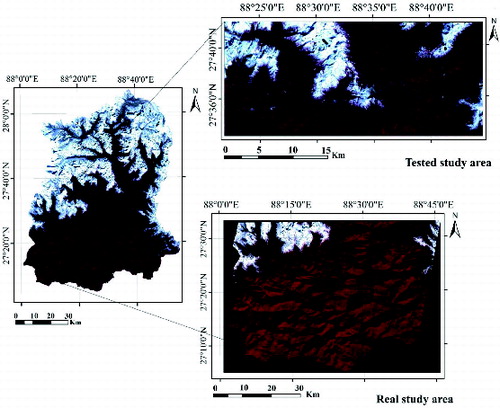
Figure 4. ΔNDVI for (a) tested study area and (b) real study area.
Figure 5. Statistical developed decision tree classification for the detection of landslides.
Figure 6. (a) The elevation map and (b) the slope map of the study area.
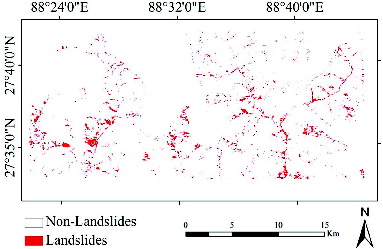
Figure 7. The spatial distribution of landslides.
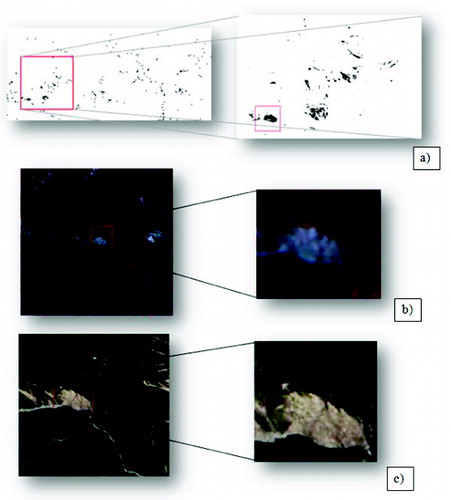
Figure 8. (a) Landslides detected by DT method; (b) the same area in LISS III image and (c) the same area in EO-1.
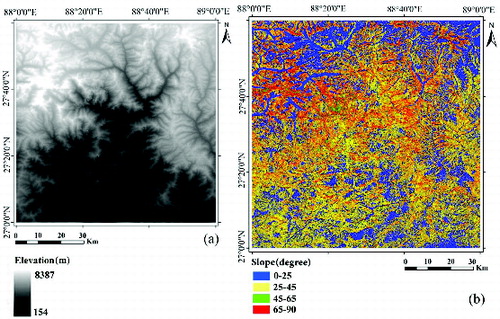
Table 1. The surface area and percentage of landslides by the slope separation in tested and real study area.
Figure 9. The area and percentage of landslides by the slope separation in (a) tested study area, (b) real study area and (c) full study area.
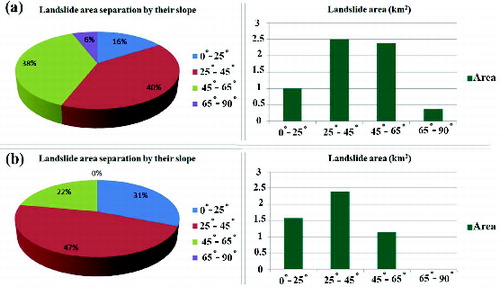
Table 2. User accuracy, producer accuracy, overall accuracy and kappa coefficient for the results derived for tested and real study area.
Figure 10. Graph of the producer and user accuracy: (a) tested study area and (b) real study area.
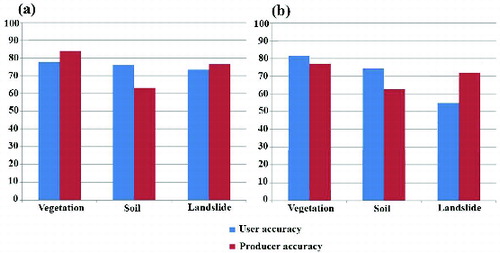
Figure 11. The spatial distribution of landslides in real study area.