
Figures & data
Figure 1. Forms of landslides (a), rock and debris fall (b) and (c) and land creeping (d). These are due to soil saturation by rainfall and wrong slope artificial designs at highly fractured mountainous areas of Malaysia.
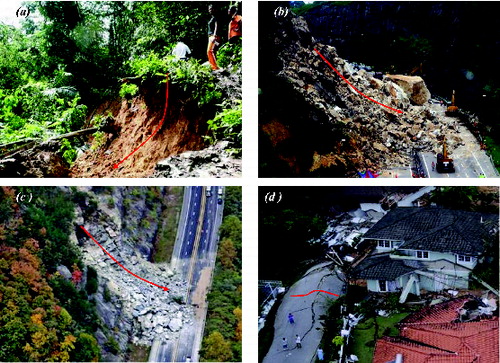
Figure 2. RGB 742 LANDSAT TM image (a) and litho-structural map of the study area (b), showing the major rock in Penang is granite, which is covered by forest.
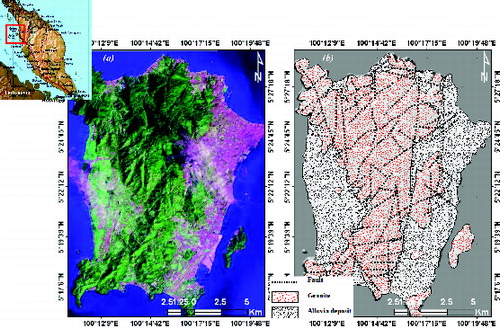
Figure 3. Flowchart of methodology used for landslide susceptibility mapping
Figure 4. Land cover/use map generated from LANDSAT images (a), stream network drains Penang (b), showing the spatial association between the occurred landside locations (the white points) and the granite erosion by forest roots and stream network.
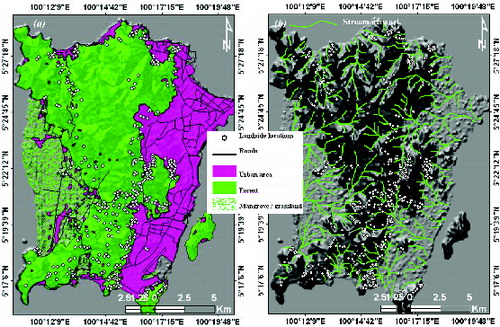
Figure 5. Slope (a), and aspect (b) maps calculated from DEM, showing the positive relationship between the slopes and the occurred landslide locations. Rose diagram shows that the common direction of escarpments and the occurred landslides is in NW–SE direction.
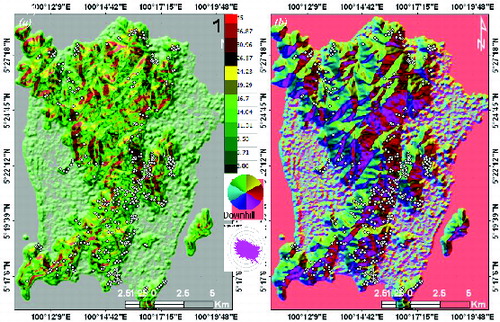
Figure 6. Relief map (a), and fault zones extracted from slope and aspect maps based on slope breaks and slope directions (b). The pink colour line highlights the regional fault zones that divide Penang into two parts and controls the direction of landslides. Rose diagram highlights the common directions of fault trends crosscutting the study area. White points highlight the known landslide locations.
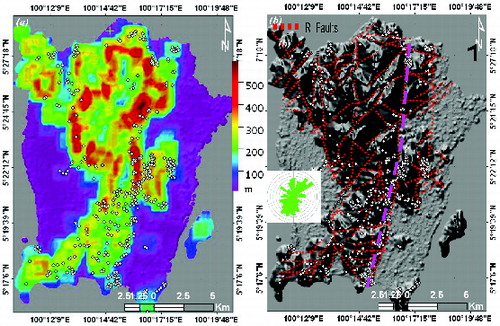
Figure 7. Landslide susceptibility map constructed using weighted spatial probability modelling. The map is draped over DEM. The white points highlight the known landslide locations. Most of the landslides are clustered along the NNE–SSW trending regional fault zone (pink colour).
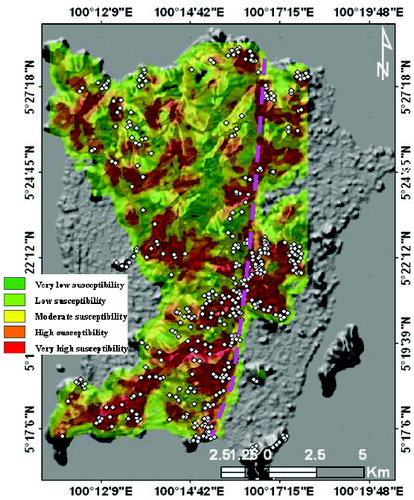
Table 1. Ranks and weights for factors and their influencing classes used for landslides susceptibility mapping.
Figure 8. Semivariograms models in N–S, E–W, NE–SW and NW–SE directions. These were generated from the two grids; the first grid constructed from the landslide susceptibility map (a) with the second one of the known (b) landslide locations.
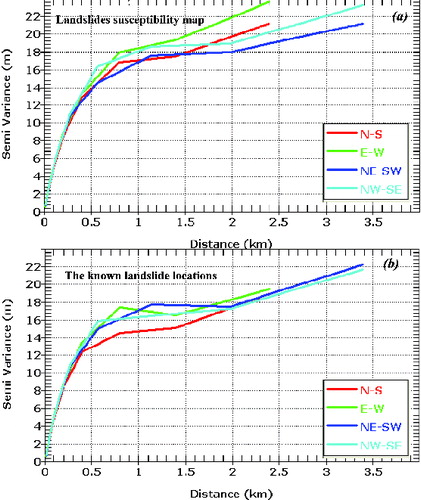
Table 2. Areas of landslide hazard classes (km2). Total granite area: 180.650 km2.
Table 3. Linear fit of constructed known and predicted semivariogram models in the four directions.