Figures & data
Figure 1. Location of the study area. Dhaka district (red polygon) and July 2004 flood study area (yellow polygon).
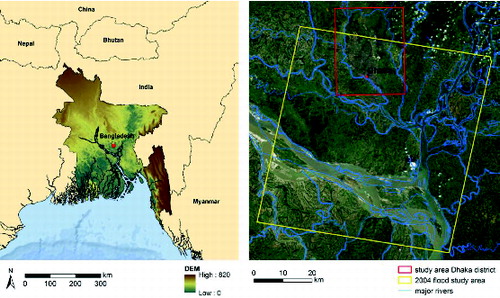
Table 1. List of the collected satellite images and their specific employment in the present work.
Table 2. Description of the informative classes adopted for land use/cover maps and training sites used for each classification.
Table 3. Example of ROI separability indexes for the classification of Landsat image acquired on October 2009. For each class-row in the table, the first line reports the separability indexes using only the six TM multispectral bands, whereas the second line shows the same indexes computed on the six multispectral bands plus the thermal band 6.
Table 4. Land use/cover change matrix (km2) between the 2000 and 2009 TM image classifications.
Figure 2. Multitemporal land use/cover maps of Dhaka: a, b, c maps were compared to quantify the urban growth; c, d, e maps were used to study the ordinary flood.
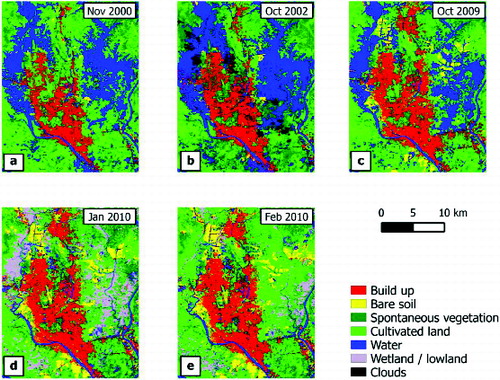
Figure 3. Ground truth points in January 2010 Landsat image; on the right, three examples extracted from the high-resolution images.
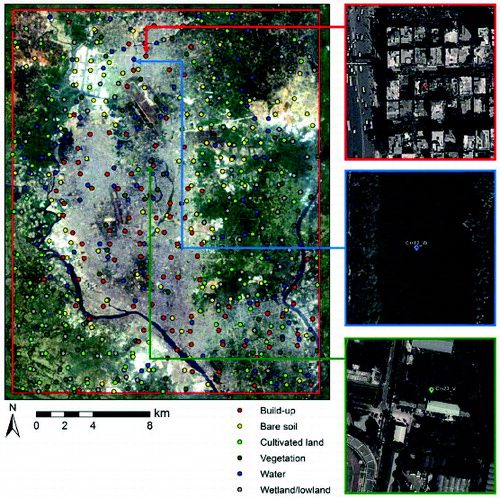
Figure 4. Omission and commission errors for each class for the three validated classifications.
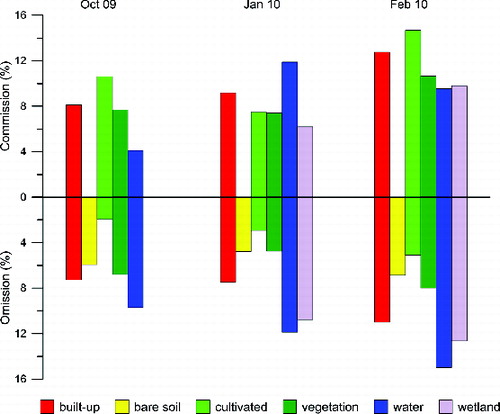
Table 5. October 2009–February 2010 land use/cover changes matrix (km2).
Figure 5. Difference of areal extension (km2) between 2009 and 2000 classifications.
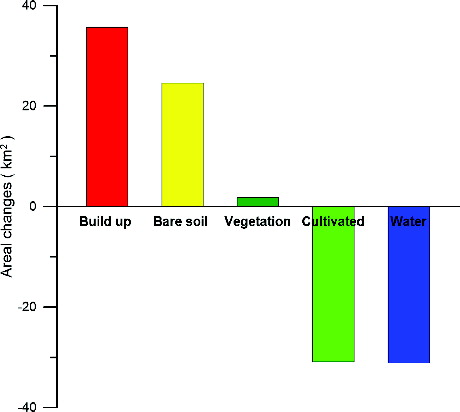
Figure 6. Development of artificial islands between 2000 (b) and 2009 (c).
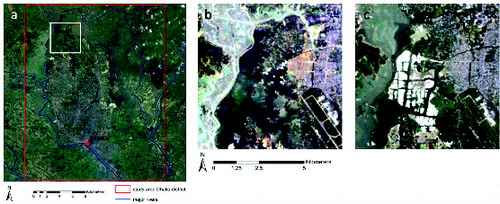
Figure 7. Urban growth map (2000–2002–2009).
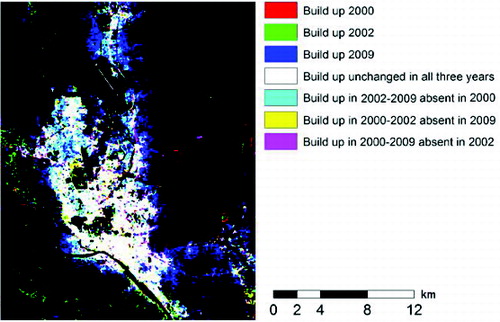
Figure 8. On the left, overlapping of the Water class pixels in the three Landsat images (October 2009, January 2010 and February 2010) combined in a RGB composition, in which permanent water bodies appear in white colour. On the right, the resulting permanent water bodies and flooded areas (Dhaka district).
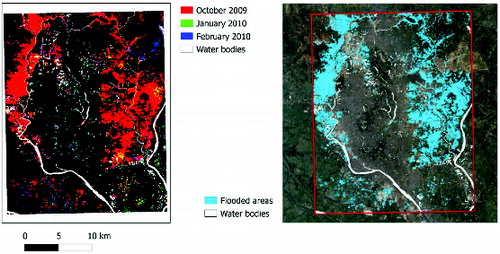
Figure 9. A portion of the Dhaka district classifications showing widespread flooding in October 2009, becoming wetland in January and cultivated land in February 2010.
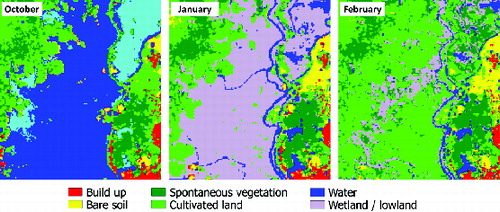
Figure 10. Analysis of 2004 extreme event: (a) pre-event setting of water bodies by Landsat 24 March 2003; (b) post-event setting of water bodies by ASTER 20 October 2004; (c) overlay of the two classifications to distinguish between permanent water bodies and flooded areas.
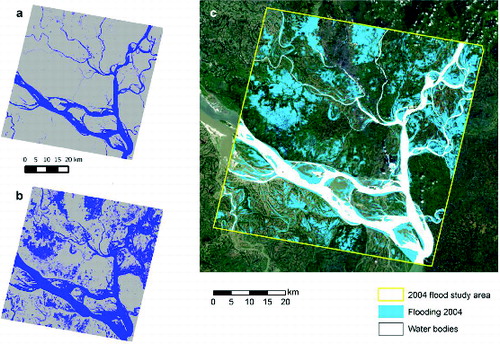
Figure 11. Flooded area for each district (km2) in 2004.
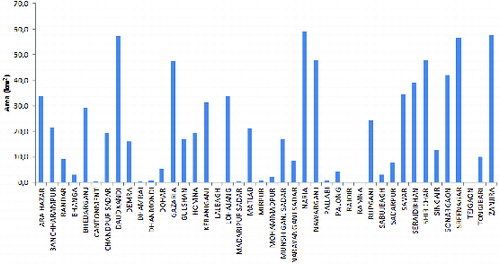
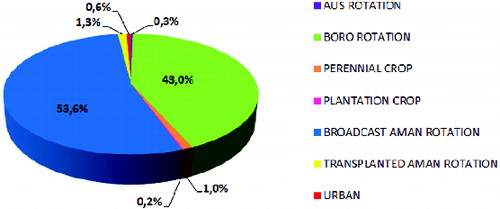
Figure 12. Land use/cover type affected by the extreme 2004 flooding event (%).