3,664
Views
6
CrossRef citations to date
0
Altmetric
Original Articles

Emergency preparedness in the case of Makran tsunami: a case study on tsunami risk visualization for the western parts of Gujarat, India

, &
Pages 826-842 | Received 16 Mar 2014, Accepted 03 Oct 2014, Published online: 28 Nov 2014

Figures & data

Table 1. Historical tsunami that affected the western coast of India.

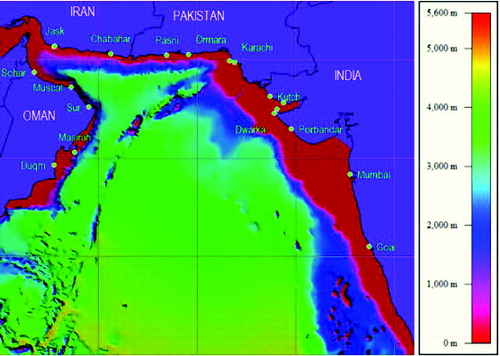
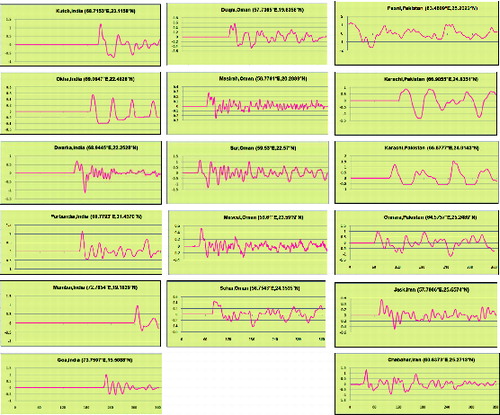
Table 2. Locations and depth of forecast points.

Table 3. The rupture parameter of 1945 Makran earthquake provided by Byrne et al. (Citation1992).

Figure 1. Tsunami forecast points indicated by circles, where the time series for tsunami run-up were calculated and presented in .

Figure 1. Tsunami forecast points indicated by circles, where the time series for tsunami run-up were calculated and presented in figure 7.

Figure 2. Results of the tsunami generation (a) and propagation modelling (b)(f).

Figure 2. Results of the tsunami generation (a) and propagation modelling (b)–(f).

Figure 3. Direction of tsunami's energy propagation.

Figure 3. Direction of tsunami's energy propagation.

Figure 4. Tsunami travel time contour map.

Figure 4. Tsunami travel time contour map.

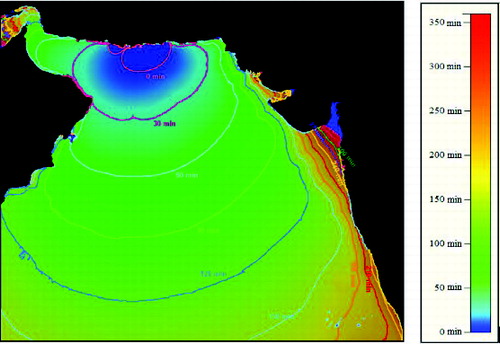
Table 4. The maximum tsunami run-up and its arrival time at various forecast points.

Figure 5. Bathymetry map in and around the study region.

Figure 5. Bathymetry map in and around the study region.

Figure 6. Maximum calculated tsunami run-up for a tsunami simulation of 360 min.

Figure 6. Maximum calculated tsunami run-up for a tsunami simulation of 360 min.

Figure 7. Time series of the calculated tsunami run-up at several locations along the coast of Iran, Oman, Pakistan and India.

Figure 7. Time series of the calculated tsunami run-up at several locations along the coast of Iran, Oman, Pakistan and India.

Figure 8. Classification of tsunami risk zone.

Figure 8. Classification of tsunami risk zone.

Figure 9. Visualization of 3D tsunami risk model of Okha with different viewing angles. To view this figure in colour, please see the online version of the journal.

Figure 9. Visualization of 3D tsunami risk model of Okha with different viewing angles. To view this figure in colour, please see the online version of the journal.

Reprints and Corporate Permissions

Please note: Selecting permissions does not provide access to the full text of the article, please see our help page How do I view content?

To request a reprint or corporate permissions for this article, please click on the relevant link below:

Academic Permissions

Please note: Selecting permissions does not provide access to the full text of the article, please see our help page How do I view content?

Obtain permissions instantly via Rightslink by clicking on the button below:

If you are unable to obtain permissions via Rightslink, please complete and submit this Permissions form. For more information, please visit our Permissions help page.