Figures & data
Figure 1. Geographic location of Saratov oblast (SO), Russia: cereal crops are growing all over and VH satellite data were collected from the black area.
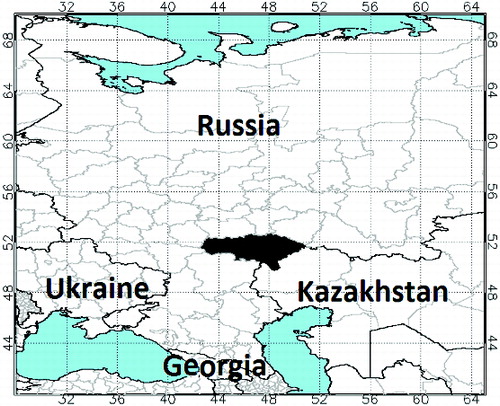
Table 1. Selection of TCI and VHI predictors for cereal's dY models based on partial correlation coefficients (PCC), Saratov oblast, Russia.
Table 2. Statistics of an independent testing of cereal models (1982--2001), Saratov oblast, Russia.
Figure 2. Cereal yield time series in SO, Russia during 1972–2001.
Figure 3. Dynamics of correlation coefficient for Saratov oblast's cereal yield departure from trend with (a) SO spatial mean VCI, TCI, and VHI and (b) with SO spatial monthly mean precipitation and temperature anomaly (deviation from climatic normal).
Figure 4. Observed and independently simulated (Equationequation 11(11) ) SO cereal yield during 2002–2012.
Figure 5. Drought area and intensity for the European Russia and western Kazakhstan in 2010–2012 (Rectangle indicates SO location).
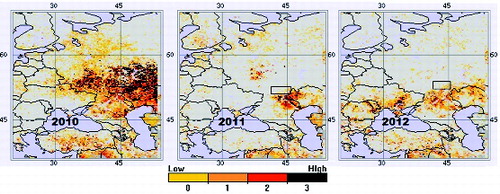
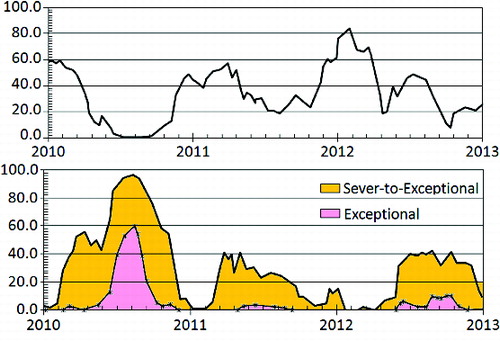
Figure 6. Saratov oblast VHI-based thermal stress dynamics (a) and per cent SO area under droughts of severe-to-extreme and exceptional intensity (b).