Figures & data
Figure 1. Tsunami vertical sign that indicates entering a hazard zone. (Photo taken by the third author at the California coast on 2013 May 13).
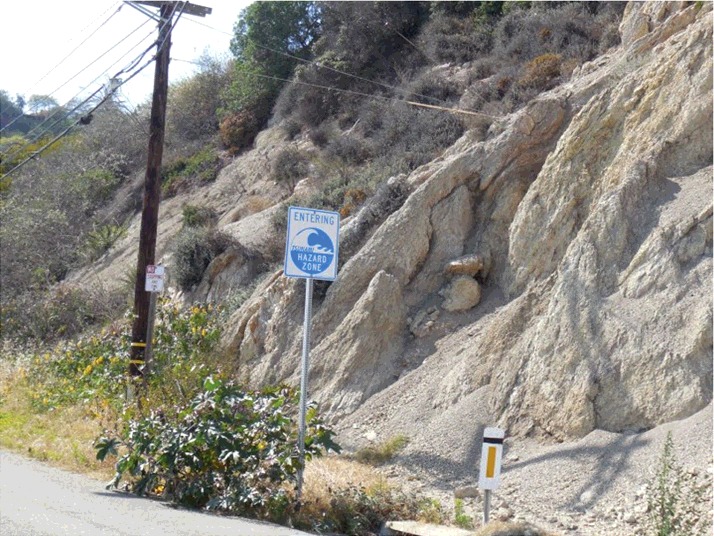
Figure 2. Location of the tide gauge stations, as presented in , and the epicentre.
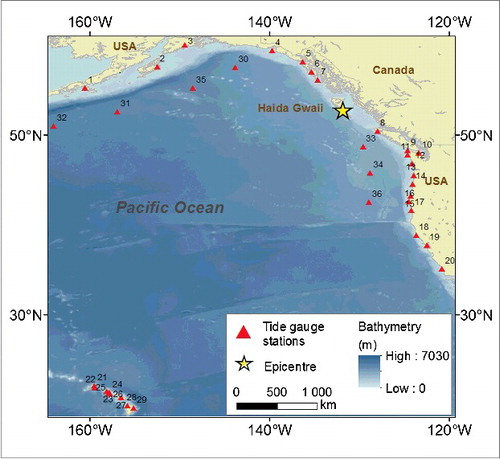
Table 1. Tide gauge stations data considered in this study.
Figure 3. The seismo-tectonics of the Queen Charlotte fault: (a) Location of the Queen Charlotte Fault and plate boundaries; (b) aftershocks of the October 28 earthquake.
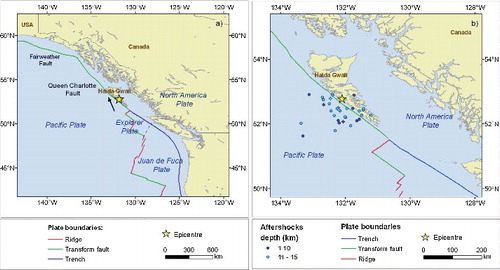
Figure 4. Historic seismicity off-shore Canada and the epicentre of the October 28 earthquake: (a) magnitude; (b) focal depth.
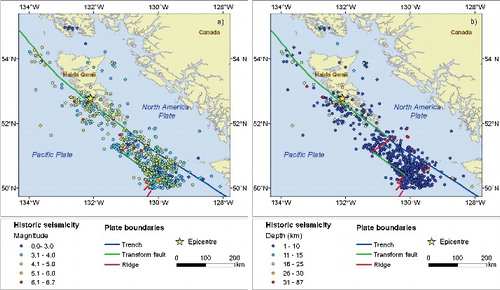
Figure 5. Tsunami numerical model results: (a) sea surface displacement, in metres; (b) tsunami travel times; (c) maximum water level.
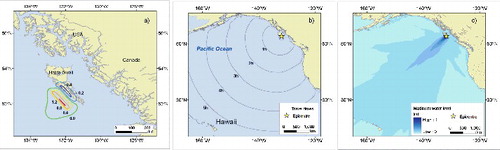
Table 2. Comparison between observed and modelled travel times.
Figure 6. Tsunami numerical model results: tsunami water level waveforms.
Figure 7. Hawaii Islands and the places described by the witnesses during the evacuation: (a) main islands; (b) Kauai; (c) Oahu; (d) Molokai; (e) Maui; (f) Hawaii (Big Island).
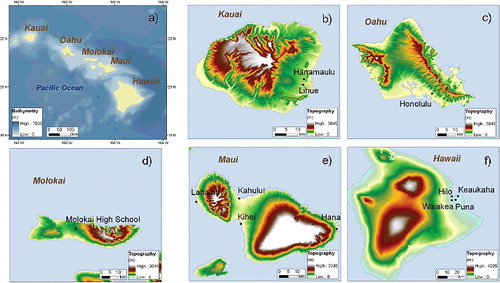
Table 3. Timeline of the evacuation process at Hawaii.
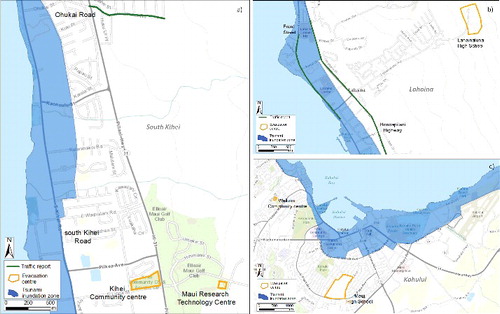
Figure 8. Evacuation details at Maui Island ((e)), showing the streets where heavy traffic was reported, the tsunami inundation areas, and the location of the evacuation areas. (a) South Kihei; (b) Lahaina; (c) Kahului.