Figures & data
Table 1. Natural disasters that occurred in Saudi Arabia from 2000 to 2015 (IDD Citation2015).
Figure 1. Hafr Al-Batin catchment area.
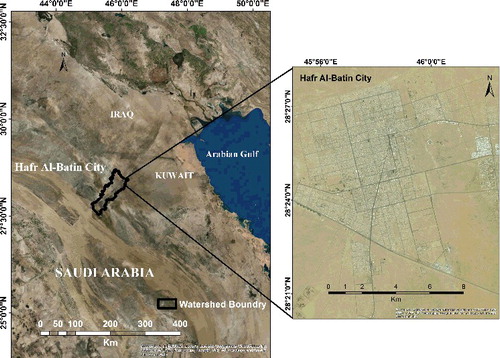
Figure 2. Maximum annual daily rainfall for Wadi Al-Batin.
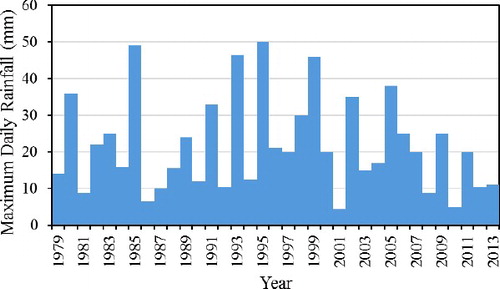
Figure 3. Fitted Log-Pearson III distribution.
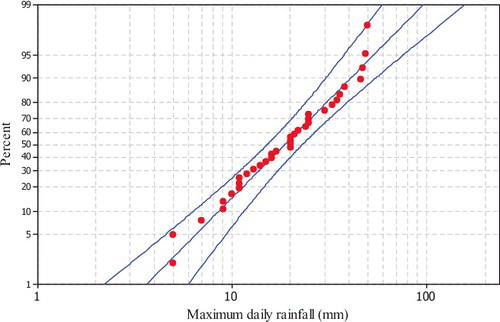
Table 2. Maximum daily rainfall (mm) for different return periods for Wadi Al-Batin.
Figure 4. Schematic diagram of the proposed flood model.
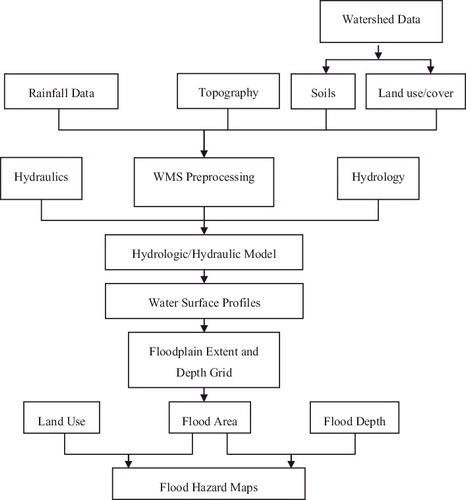
Figure 5. Hafr Al-Batin digital elevation model (DEM).
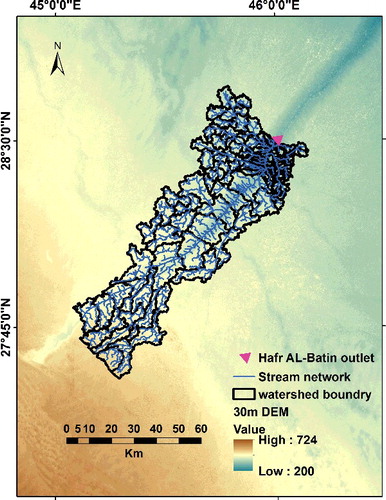
Table 3. Curve number (CN) values.
Figure 6. Rainfall hyetograph: (a) 6-minute hyetograph for 100-year storm and (b) 6-minute hyetograph of the 2-, 5-, 10-, 25-, 50- and 100-year storms.
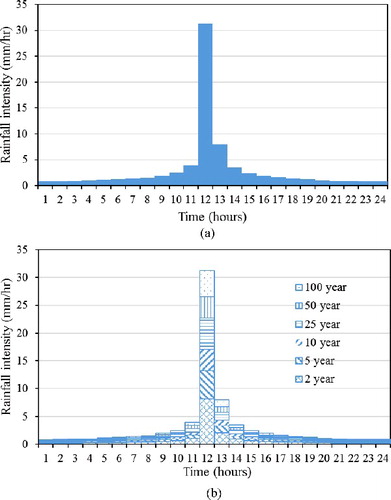
Figure 7. HEC-HMS basin model of Hafr Al-Batin watershed.
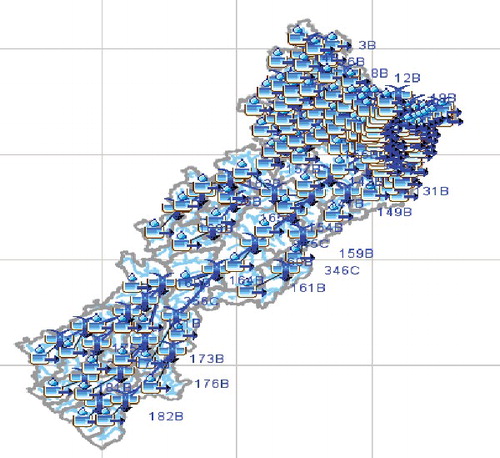
Figure 8. Outlet hydrograph of Hafr Al-Batin watershed for a return period of: (a) 2 years, (b) 5 years, (c) 10 years, (d) 25 years, (e) 50 years and (f) 100 years.
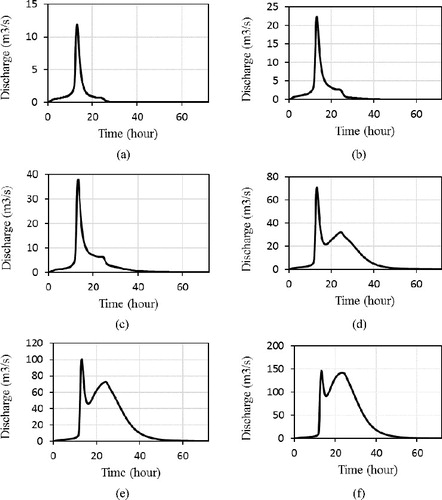
Table 4. Peak discharge, runoff volume and estimated inundated area for different return periods.
Figure 9. Main reaches and sections along the main channel of Hafr Al-Batin watershed.
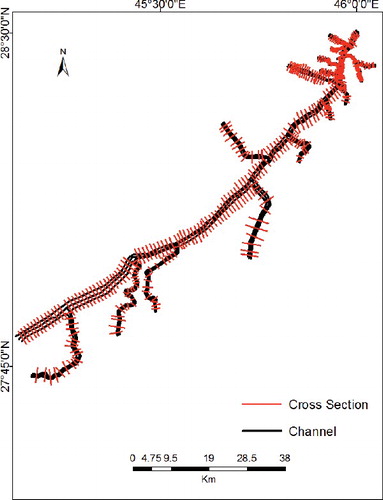
Figure 10. Water surface elevations at the outlet for different return periods.
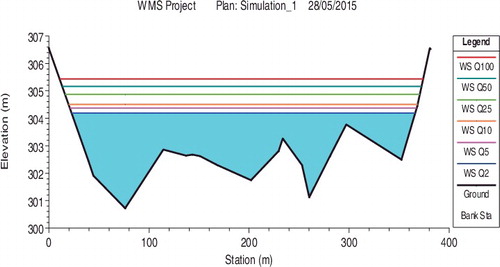
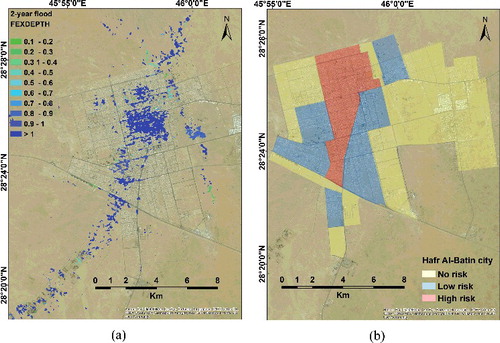
Figure 11. Flood hazard maps developed by (a) WSM and (b) Hafr Al-Batin municipality.