Figures & data
Figure 1. Geological and geomorphological framework of the study area.
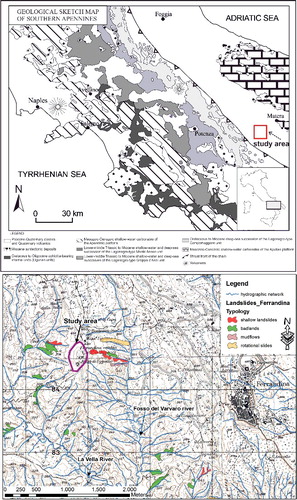
Figure 2. Site investigation with octocopter drone and perspective scheme of images detected at different levels with octocopter drone.
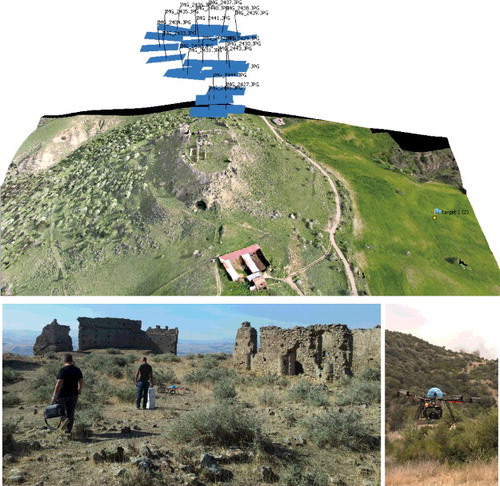
Table 1. Synthesis of the multi-temporal images used in this study.
Figure 3. Multi-temporal aerial-photos and UAV images used in this study.
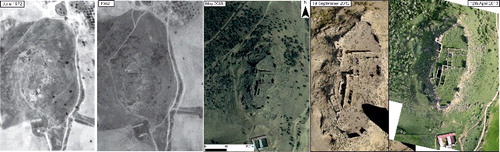
Figure 4. Stratigraphic section of the Pleistocene regressive marine and transitional sedimentary sequence, outcropping in the Uggiano site.
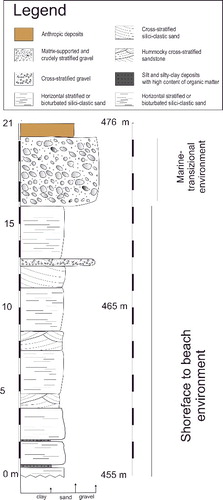
Figure 5. Outcropping of cemented sandy-pebbly shoreface deposits (a) on which the foundations of wall are based (b). The picture (b) shows clearly the erosional processes acting at the base of relict castle walls.
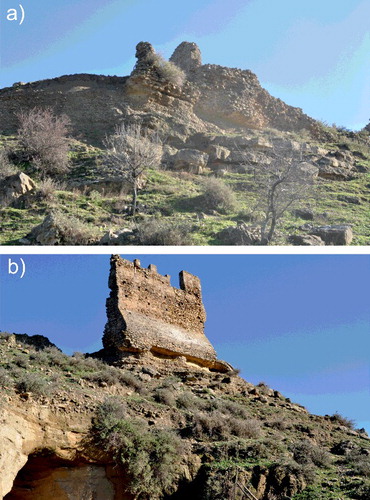
Figure 6. Graphic reconstruction of the Uggiano Castle. Legend: tower of the five cantons (1); the tower of Gennaro (2); entrance (3); prison (4); courtyard or square (5); courtyard (6); chapel (7), or a Church just begun and below it a tank under construction; building/stable (8); kitchen (9); courtyard (10), where there is a big cystern with two openings, partially collapsed (see photos); garden (11), around which stand the defensive walls, all around the castle, with other towers adorned with battlements and other buildings.
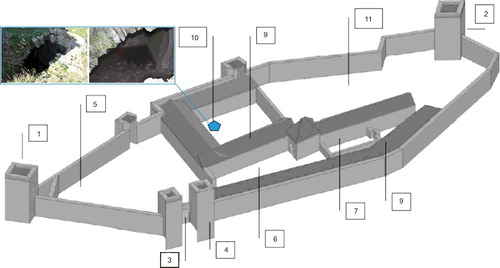
Figure 7. Temporal evolution of damages suffered by fortified archaeological site from 1964 (a) and 1966 (b) to 2013 (c). c1) inlet points of piping erosion phenomena affecting the study area.
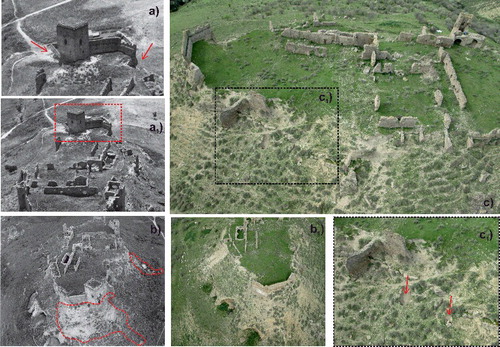
Figure 8. Geomorphological hazard map of the study area on a photo mosaic of images detected by the drone on 12 April 2013.
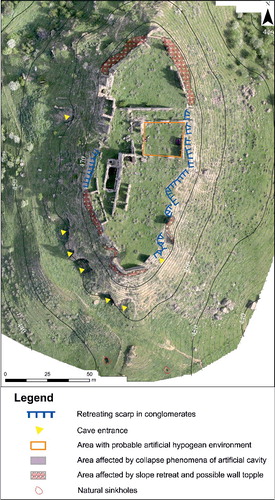
Figure 9. Old repertory images of the three towers collapsed presumably in March 1973 in a photo of the 1960s. Arrows indicate their position in the reconstruction of .
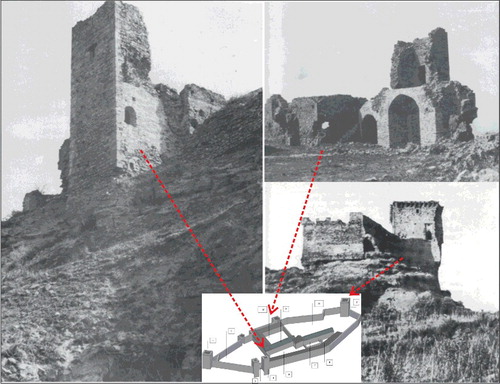
Figure 10. The picture shows the ‘Gennaro's Tower’ (n° 2 in ) existing until 1972, compared with the relict structures of the tower and toppled walls after the collapse, related to slope retreating and erosion, acting at the base of the foundations.
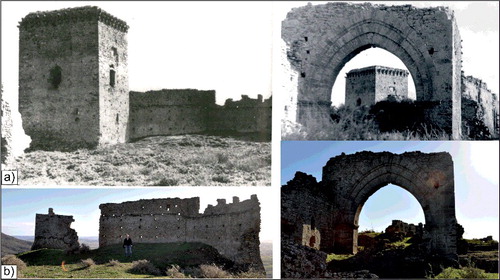
Figure 11. Comparison between 1972 and 1982 images in which it is possible to observe the presence of the towers in 1972 (circles) and their disappearance in 1982 with the presence of heaps of rubble of collapsed walls (arrows and dashed circle).
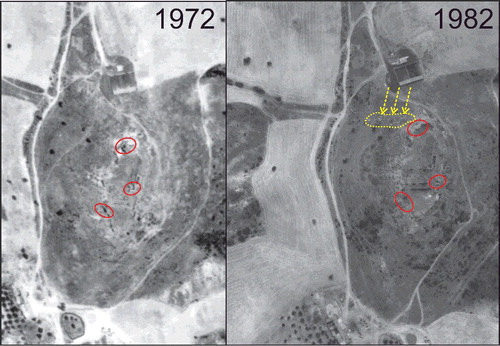
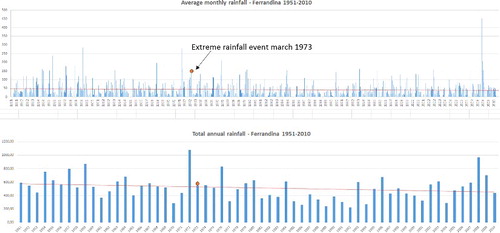
Figure 12. Histograms that show the trend of the total rainfall and average monthly rainfall measured by the Ferrandina meteorological station, with evidence of the extreme rainfall peak, which has accelerated the erosion processes responsible of the collapse of the towers.