
Figures & data
Figure 1. Study area location (source: ESRI Basemap).
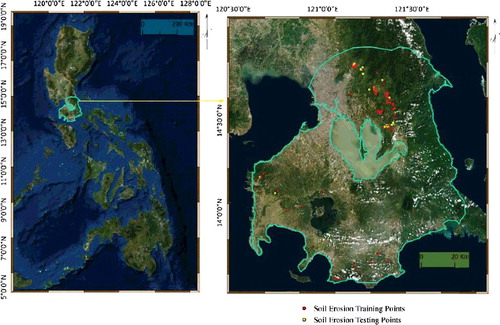
Figure 3. Soil erosion probability index maps achieved by (a) EBF and (b) FR methods.
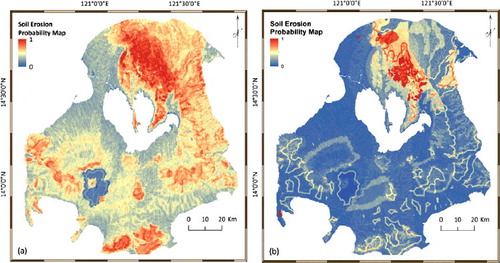
Figure 4. Soil erosion susceptibility maps achieved by (a) EBF and (b) FR methods.
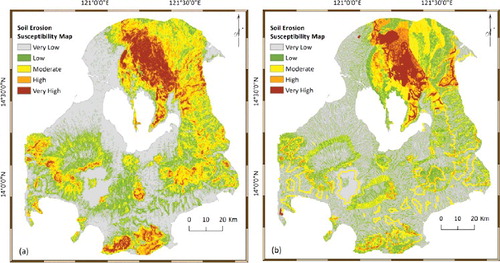
Figure 5. AUC success rate and prediction rate of (a) EBF and (b) FR methods.
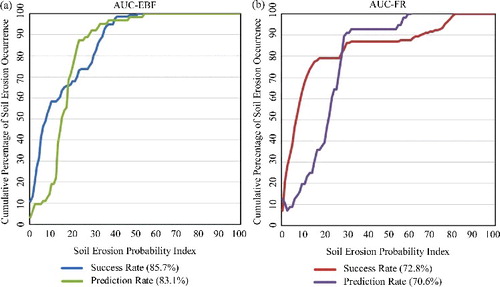
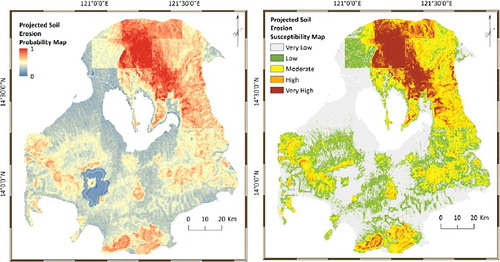
Figure 6. Projected soil erosion probability index map (left-hand side map) and susceptibility map (right-hand side map) by 2100 through EBF method.
Supplemental material