Figures & data
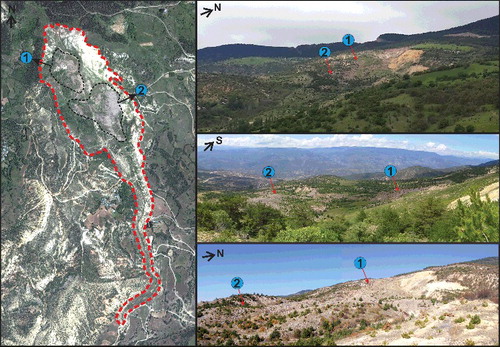
Figure 1. The study area (Koyulhisar City, Turkey) and landslide border (in yellow colour).
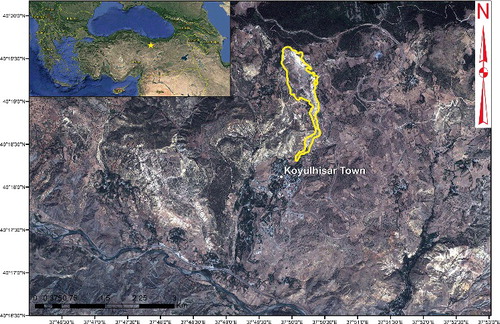
Figure 2. The geological map of the study area (Demirel Citation2015).
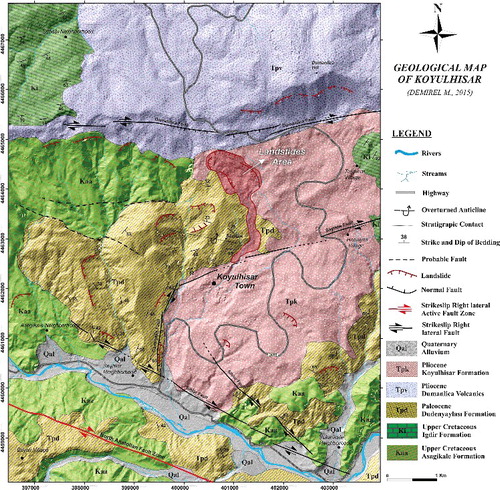
Figure 3. The methods followed in the study.
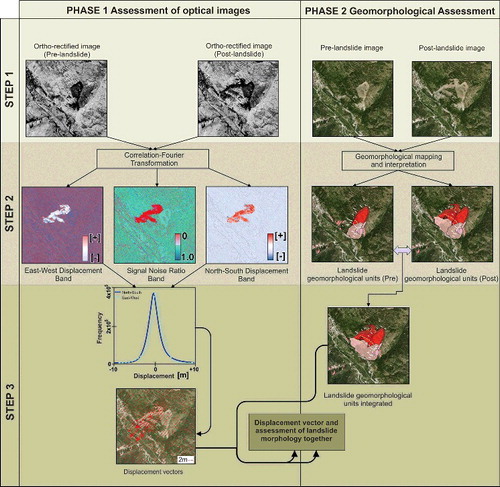
Figure 4. Distributions of errors and standard deviation values of GCPs.
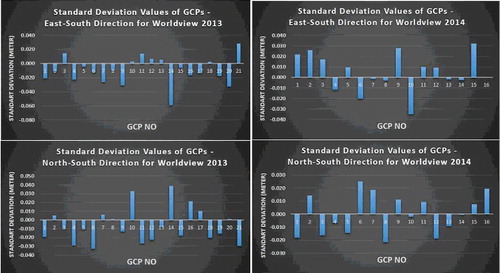
Figure 5. It shows the SNR value against the number of samples. Despite the fact that the SNR bands from 64 × 8, 64 × 16, 64 × 32 (window × step size) have a similar value and trend, the SNR from 32 × 4 combination has more affinity to the correlation value of 1.
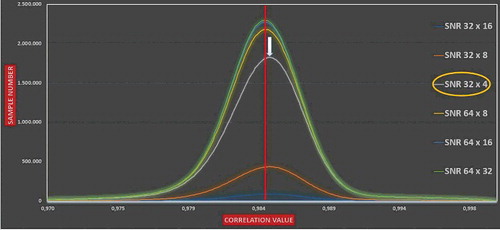
Figure 6. It shows the SNR band of the Worldview 1 (11 August 2013) and Worldview 1 (26 August 2014) image correlation. Although the SNR ranges from 0 to 1, here it is shown to be from 0.97 to 1 for a better coherence. Decorrelation areas (cloud cover, landslide, vegetation, etc.) are shown in different geometric figures such as an ellipse, rectangle and polygon. The ellipses in green colour indicate forest areas. The rectangle in red colour shows the centre of Koyulhisar city. The polygon in blue colour indicates the landslide area.
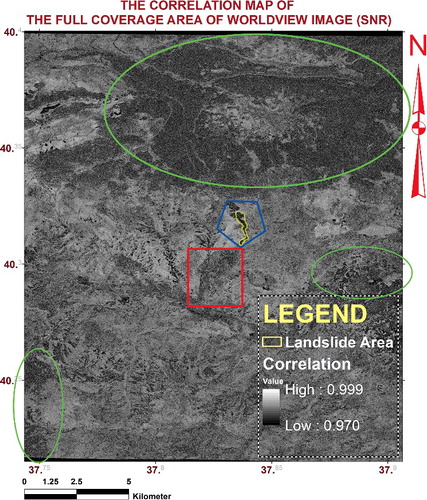
Figure 7. The displacement map and mass movements obtained by the Cosi-Corr method.
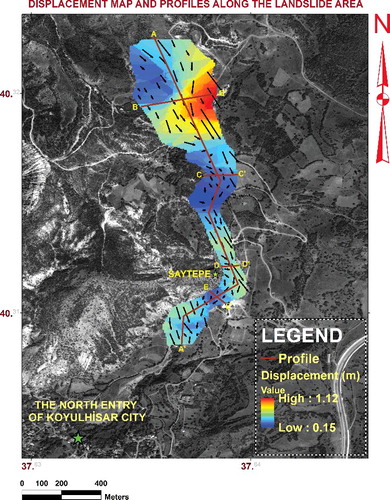
Figure 8. Displacements obtained along the profile and cross-sections.
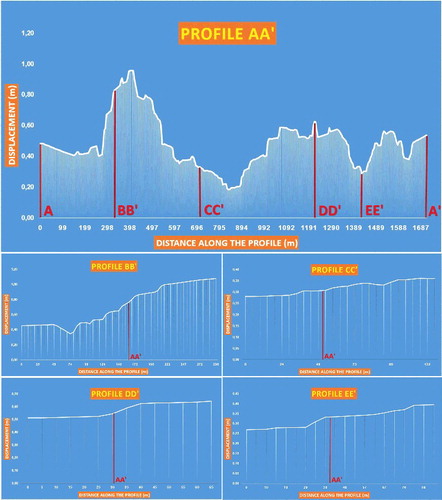
Figure 9. The block-rock-sized materials moving within the landslide.