Figures & data
Figure 1. Soil type distribution and category description for the Dubračina catchment.
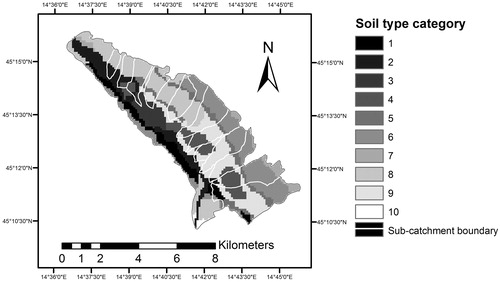
Figure 2. Distribution of the Dubračina catchment sub-catchments.
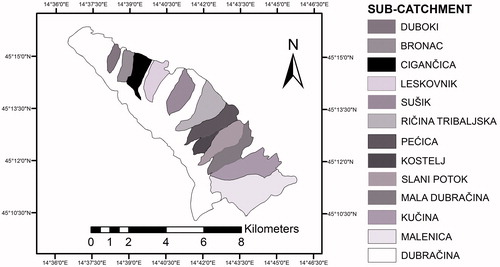
Table 1. Characteristics of Dubračina catchment and its sub-catchments.
Figure 3. Flow chart of the model based on the EPM.
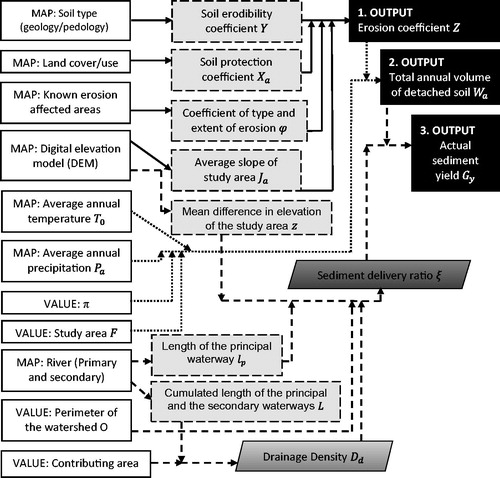
Table 2. Descriptive evaluation of the method parameters (de Vente and Poesen Citation2005; Haghizadeh et al. Citation2009) and the numerical and descriptive evaluation for the erosion coefficient Z applicable in the Mediterranean area (de Vente and Poesen Citation2005).
Figure 4. Soil protection coefficient according to numerical evaluation of different land cover/use maps: (a) Landsat 4 and 5 data source, (b) Landsat 8 data source.
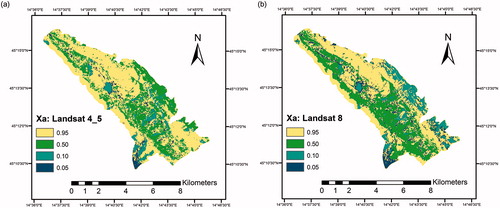
Figure 5. Land cover for the Dubračina catchment based on Landsat 8 images: (a) winter; (b) spring; (c) summer; (d) autumn.
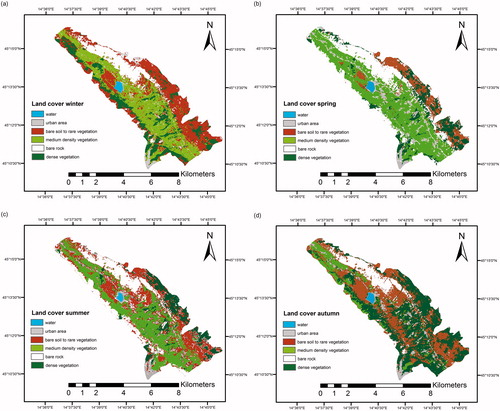
Figure 6. Erosion coefficient Z for the Dubračina catchment based on the EPM: (a) past time 1961–1990, (b) present time 1991–2020.
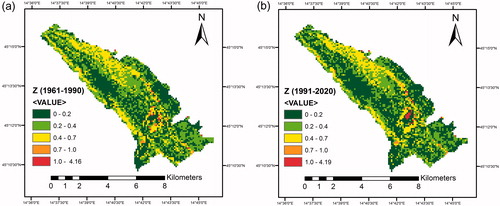
Figure 7. Total annual volume of the detached soil Wa in m3/cell/year for the Dubračina catchment based on the EPM: (a) past time 1961–1990, (b) present time 1991–2020.
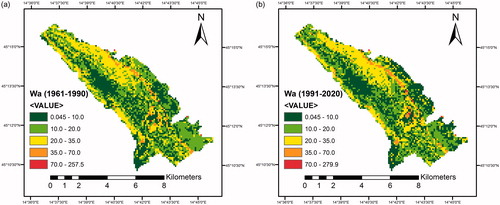
Figure 8. Actual sediment yield in m3/cell/year for the Dubračina catchment based on the EPM: (a) past time 1961–1990, (b) present time 1991–2020.
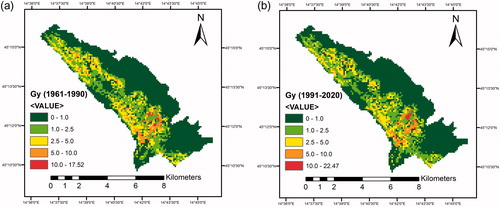
Table 3. Descriptive statistics for the derived past and present model outputs (,
,
) for the entire catchment of Dubračina.
Table 4. The minimum, mean and maximum change in sub-catchments between the time series for all three model outputs (Z, Wa, Gy).
Figure 9. Erosion coefficient (a) winter, (b) spring, (c) summer, (d) autumn.
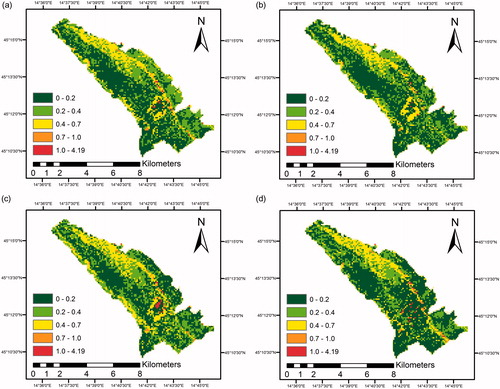
Table 5. Descriptive statistics obtained using the EPM model and the representative model outputs.
Figure 10. Estimation of erosion coefficient (), redistribution of the soil loss (
) and transported sediment yield (
) within the seasons and comparison with annual soil loss for present time (
).
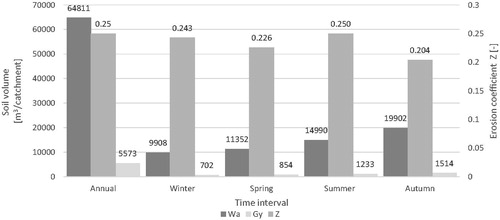
Figure 11. Observation points on the land cover representing the present time and the summer season from 6.8.2013.
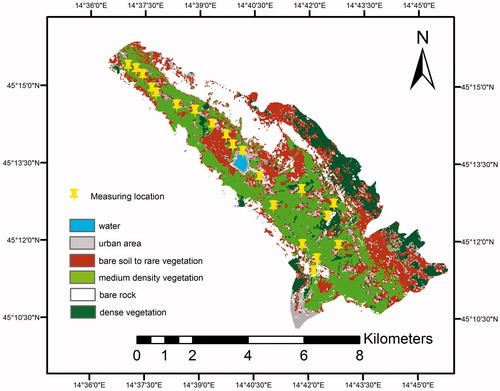
Table 6. EPM and field survey erosion coefficient estimation on 20 different locations.
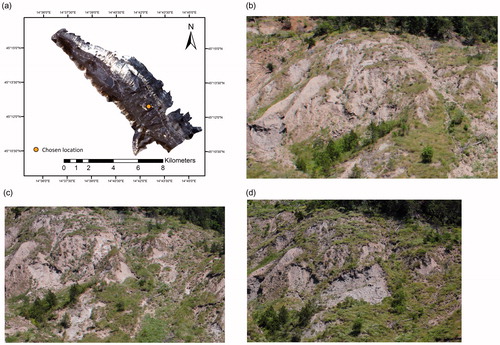
Figure 12. Chosen location for surface soil loss observations: (a) the location in the Dubračina catchment, (b) photograph of the location taken in June 2014, (c) photograph of the location taken in June 2015 and (d) photograph of the location taken in July 2016.