Figures & data
Figure 1. Geographic location of the study area.
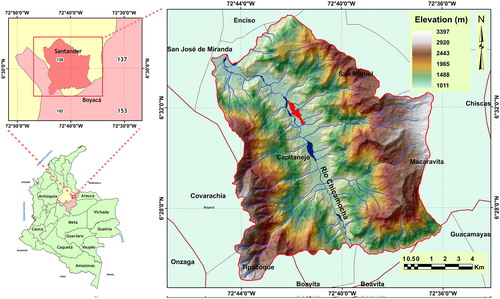
Figure 2. Geological map (a), adapted from the geological map scale 1:100,000 (Vargas et al., Citation1976) and a morphogenetic map (b).
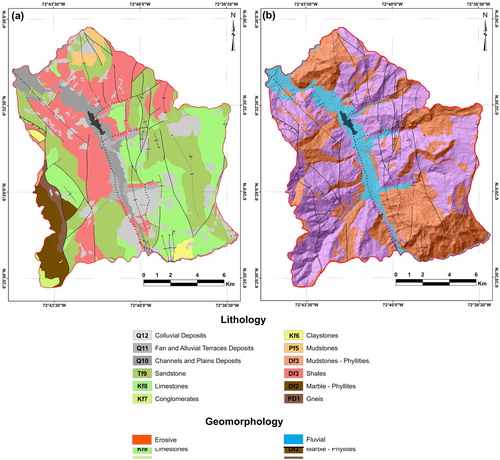
Figure 3. Hillside movements in the study area. Debris slide (a, d, e and f), rock and debris fall (b and c), creep (g), and lateral undercutting (h), products of the course of the channel of Chicamocha River (Provided by Jorge Leonardo Chaparro).
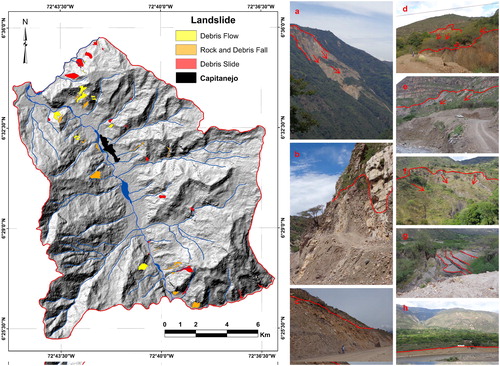
Figure 4. Methodological flow for landslide susceptibility. SPI: stream power index; TWI: topographic wetness index; SGC: servicio geologico colombiano; DEM: digital elevation model.
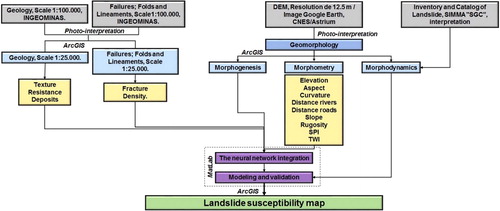
Figure 5. Classification of lithology depending on resistance (a), texture (b) and fracture density (c).
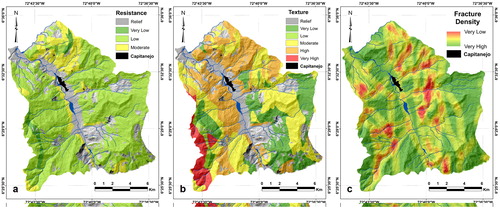
Figure 6. Morphometric variables. Elevation (a), aspect (b), curvature (c), distance to rivers (d), distance to roads (e), slope (f), rugosity (g), SPI (h) and TWI (i).
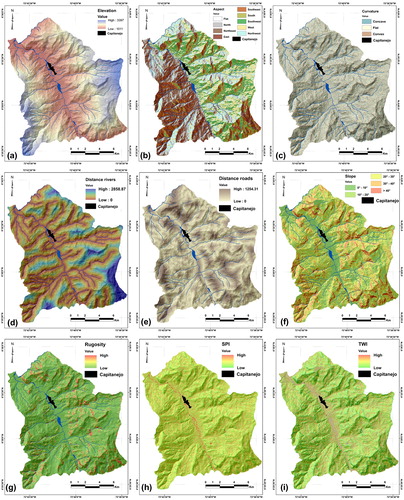
Table 1. Factors evaluated and representation in the area.
Figure 7. Processing structure of the ANN.
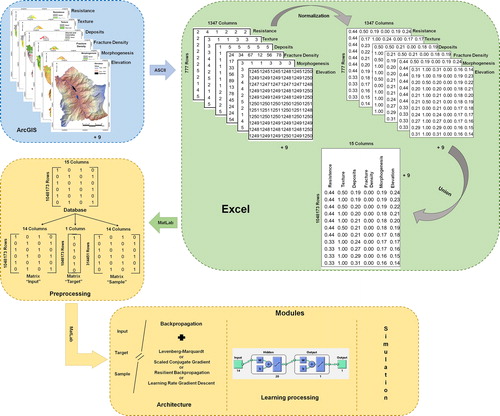
Table 2. Results of structures with better performance in the learning stage.
Table 3. Assignment of weights inside the backpropagation structure and SGC function.
Figure 8. Landslide taken for the neural network in the north zone (a), simulation of the ANN (b) and inventory of landslide (c).
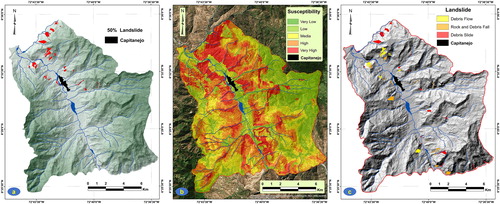
Figure 9. Susceptibility map for landslides.
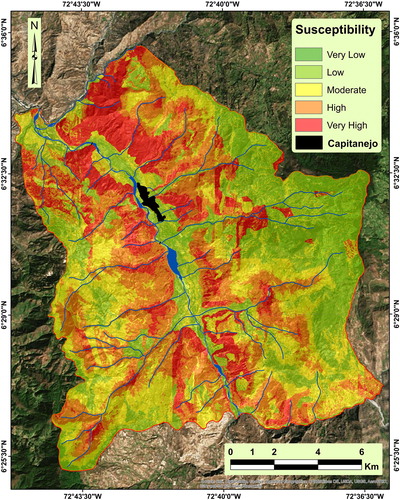
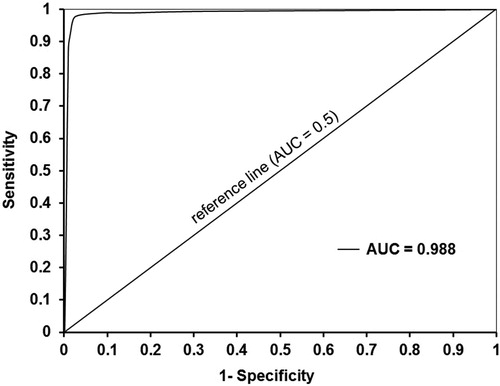
Figure 10. ROC curve of the landslide susceptibility model obtained using an ANN.