Figures & data
Figure 1. Histogram of different image sources. (a) document image with homogeneous background and uniform illumination (Image from Wen et al. Citation2013). (b) remote sensing image with inhomogeneous background and complex illumination (Image was taken after Ms 7.0 Lushan earthquake in April 20, 2013).
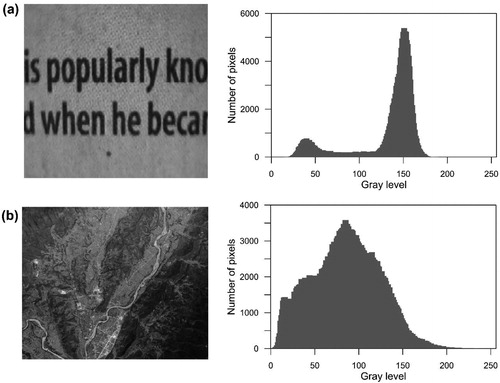
Figure 2. Schematic illustration for image partitioning using blocks in a Monte-Carlo step. Blue region represents the area that partitioned by square blocks, while red region denotes the remaining fragmented area that partitioned by the rectangular blocks.
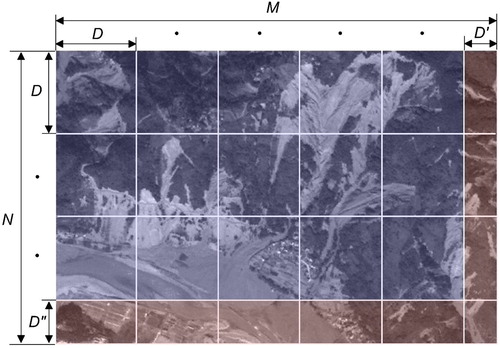
Figure 3. Procedure of the proposed Monte-Carlo iteration algorithm.
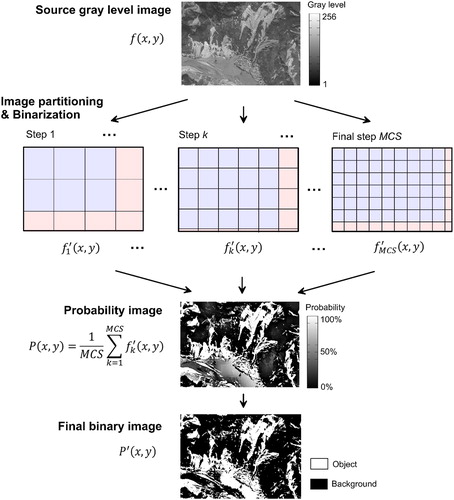
Figure 4. In the post-processing, Digital Surface Model (DSM) is incorporated to exclude the plain and rivers.
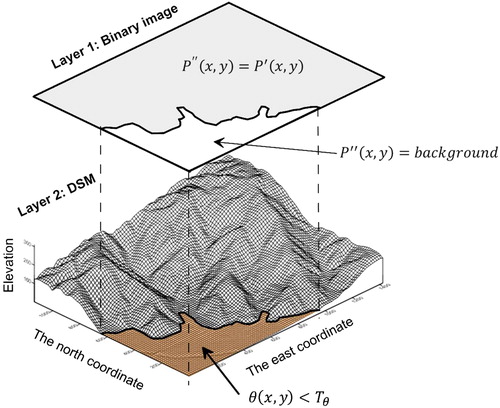
Figure 5. Benchmark test 1. (a) The imported image; (b) Otsu’s method; (c) Niblack’s method with block size of 15; (d) Niblack’s method with block size of 50; (e) Probability image by the proposed method; (f) Final binary image by the proposed method.
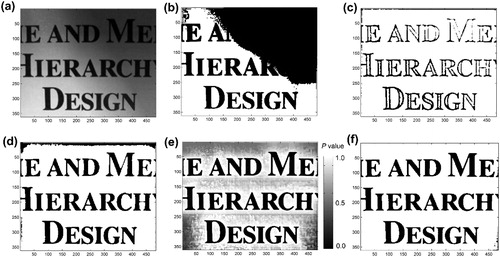
Figure 6. Benchmark test 2. (a) The source image; (b) Otsu’s method; (c) Niblack’s method with block size of 15; (d) Niblack’s method with block size of 50; (e) Probability image by the proposed method; (f) Final binary image by the proposed method.
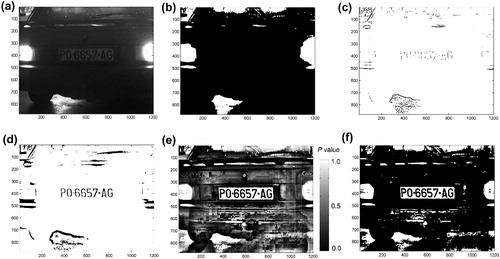
Figure 7. (a) Location of the study area. Image from Google Earth, taken at May 2001; (b) PAN SPOT5 image used for landslides detection. Image was taken at September 2008.
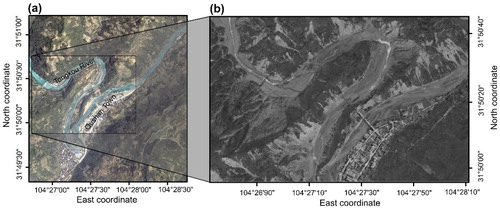
Figure 8. Binarizing results using the proposed method. (a) Probability map generated by 50-steps Monte Carlo iteration; (b) binary image using a probability threshold .
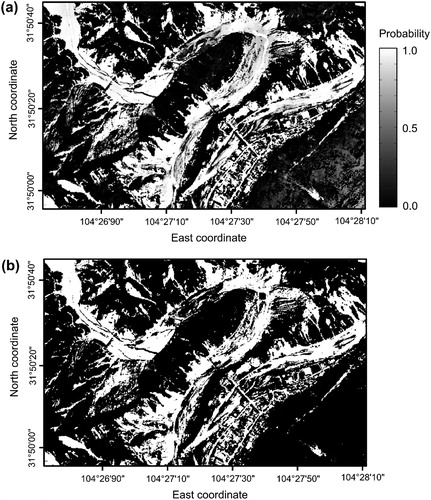
Figure 9. Ten meter resolution DSM data of the study area for excluding plains and rivers. Data was provided by Chinese Geological Survey in 2001. (a) hillshade and contour map; (b) slope gradient map generated from DSM data, using TopoToolbox (Schwanghart and Scherler Citation2014).
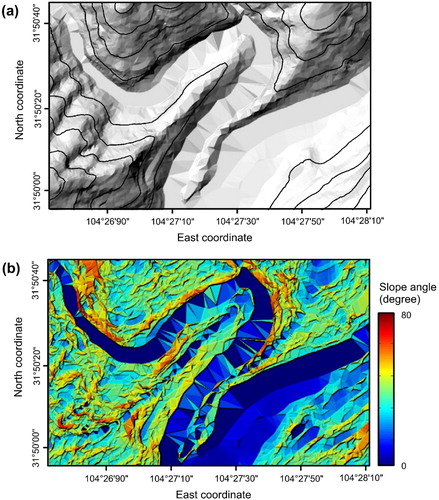
Figure 10. Final detection of landslides based on the binary image and the DSM data.
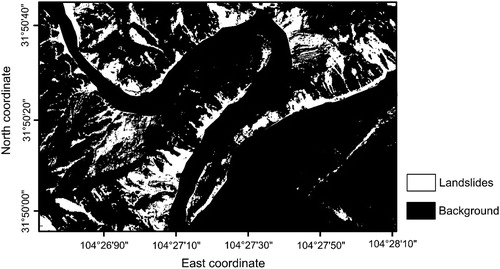
Figure 11. Comparison of the detection result between the proposed method and manually visual delineation.
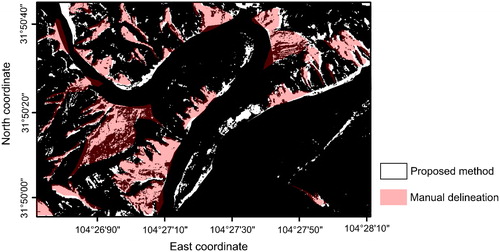
Table 1. Computational complexity of the proposed and the previous thresholding method.
Table 2. Comparison of computational complexity of the methods.
Figure 12. The tendency of computation complexity upon various image resolutions among the proposed method and Niblack’s method ().
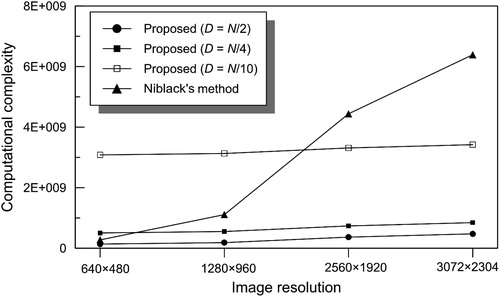
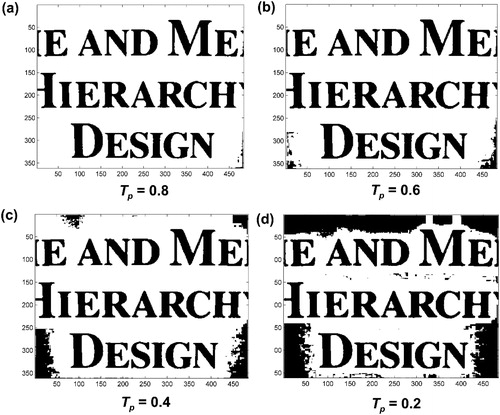
Figure 13. The variation of binarization against different values of
.
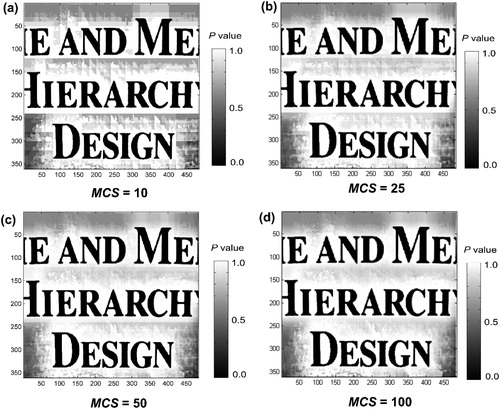
Figure 14. The variation of the probability map results against different values of .