Figures & data
Figure 1. Spatial distributions of 10 first-order basins. I refers to Northwestern River Basin; II refers to Songhua River Basin; III refers to Liaohe River Basin; IV refers to Haihe River Basin; V refers to Yellow River Basin; VI refers to Huaihe River Basin; VII refers to Yangtze River Basin; VIII refers to Southwestern River Basin; IX refers to Pearl River Basin; X refers to Southwestern River Basin.
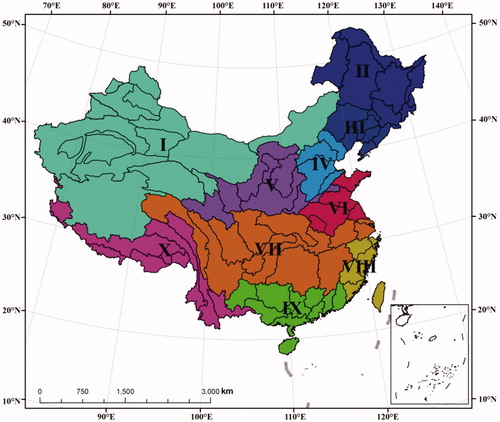
Table 1. Scale of binary comparison.
Table 2. Correlation coefficients between water resources and their associated factors for the 10 first-order basins in China.
Table 3. Relative weighting factors for the Analytic Hierarchy Process (AHP) (taking Yangtze River Basin as an example).
Table 4. Relative weighting of different catchment types.
Figure 2. Spatial patterns of standardized factors (a) evapotranspiration; (b)aridity; (c) precipitation; (d) catchment area; (e) slope;(f) vegetation coverage.
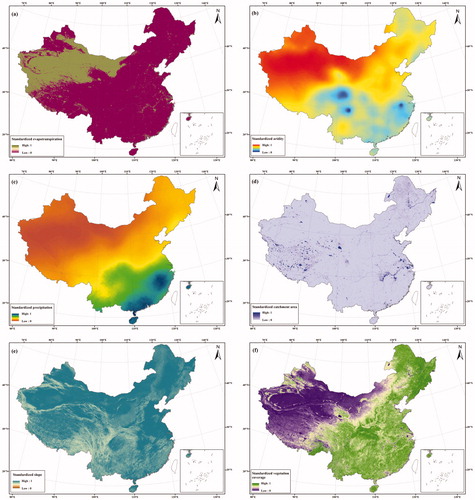
Figure 3. Gridded spatial distrubution of water resources.
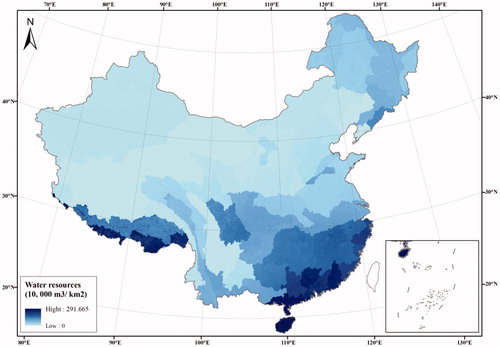
Table 5. Weights of factors for ten first-order basins.
Figure 4. Spatial patterns of population density.
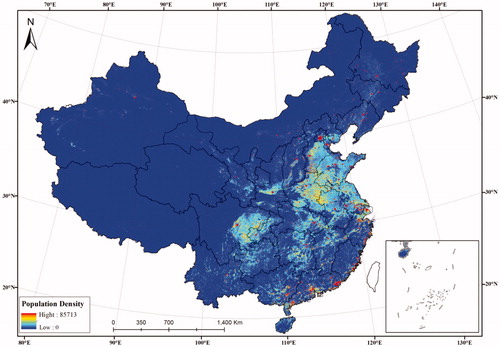
Figure 5. Spatial patterns of water resource deficit.
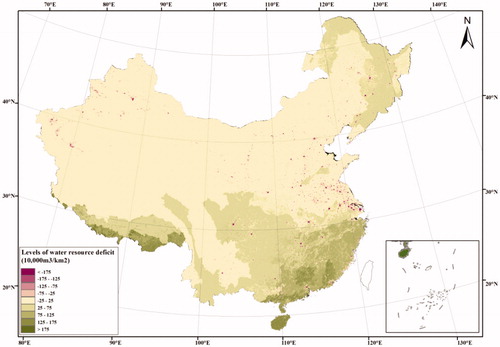
Figure 6. The spatialization error of gridded water resource distribution based on 127 third-order basins.
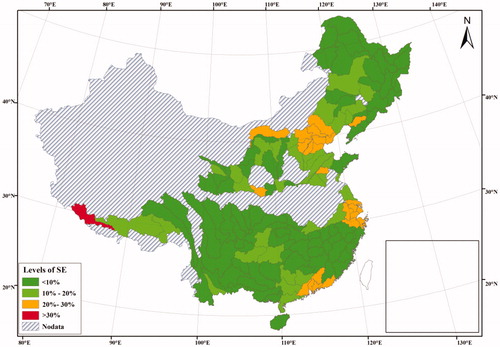
Figure 7. The spatialization error of gridded water resource distribution based on provincial administrative units.
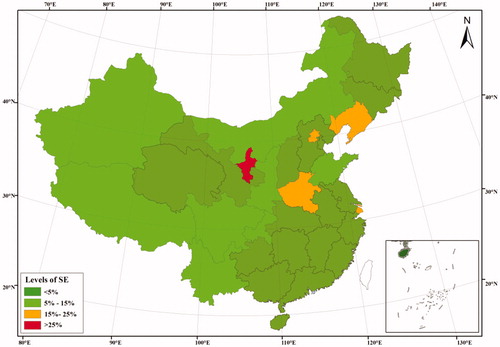
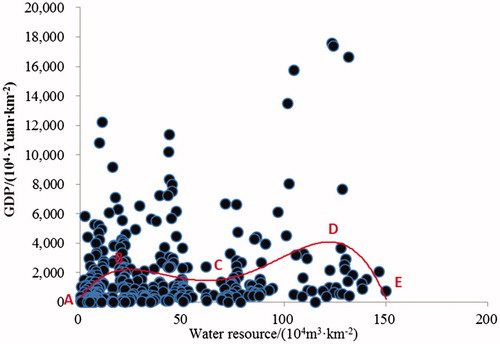
Figure 8. Relationship between GDP density and water resource distribution.