Figures & data
Figure 1. Shaded relief map of the Datong basin. Counties are depicted with small circles. The black stars indicate earthquake locations. The diamond indicates the location of the volcanic arc. Near the black stars, the digits above the short line indicate the earthquake magnitude, and the digits below the short line indicate the time of earthquake occurrence. The solid polylines indicate the main faults in the region. The inset at the top-left is the base map of Datong, Shanxi Province, China. The light-blue solid line box shows the coverage of the descending Envisat ASAR images, and the black solid line box shows the coverage of the ascending ALOS PALSAR images.
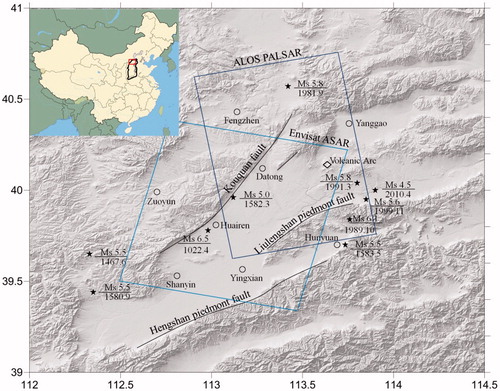
Table 1. Information of SAR data used in this study.
Figure 2. Baselines of interferograms from Envisat ASAR (left) and ALOS PALSAR (right). The Y-axis shows the perpendicular baseline in meters, and the X-axis shows the image acquisition dates. All of the connecting lines represent interferometric pairs used for time-series analysis.
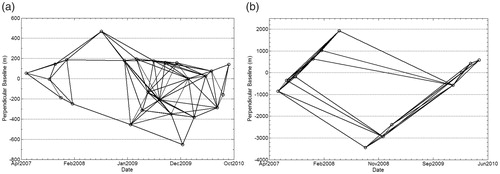
Figure 3. InSAR results of annual average deformation rates in LOS from C- and L-band. (a) InSAR results from C-band Envisat ASAR images, (b) InSAR results from L-band ALOS-1 PALSAR images. The black box indicates the reference area of ground deformation. The solid triangles represent the positions where the time series results were extracted in .
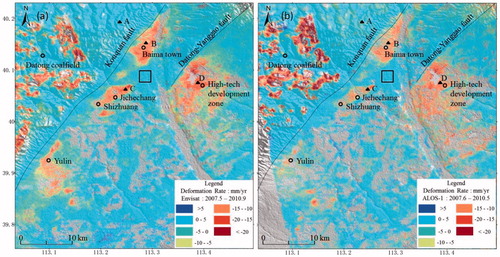
Figure 4. Distribution of the difference between the C-band and L-band InSAR results.
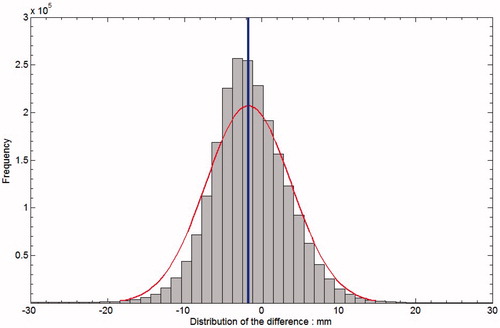
Figure 5. InSAR time series results for selected points (a, mountain; b, town of Baima; c, Jichechang; d, high-tech development zone).
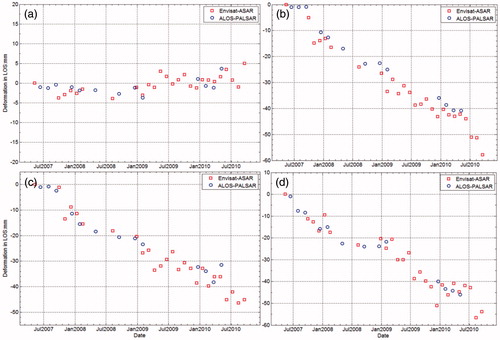
Figure 6. Two-dimensional displacement obtained from C-band (descending) and L-band (ascending). (a) Displacement rate in the east–west direction. Eastward displacement is positive and westward displacement is negative. (b) Displacement rate in the vertical direction. Negative values represent subsidence and positive values represent uplift. The closed pink curves represent underground water level fall funnel locations. I, II, and III represent the fall funnels for Gudian–Baima, Shizhuang, and Zhijiabao, respectively. The circle with the cross shows the location of the underground water level monitoring station that was mentioned in Section 4.2. Two opposing triangles represent levelling stations mentioned in Section 4.3. The numbers 1–5 represent the GF numbers crossed by profile P2–P2’.
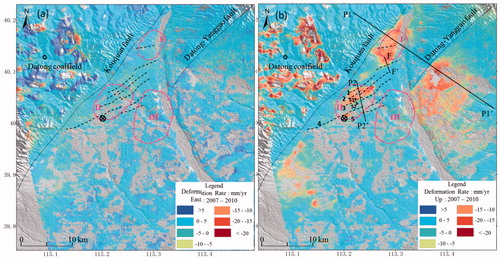
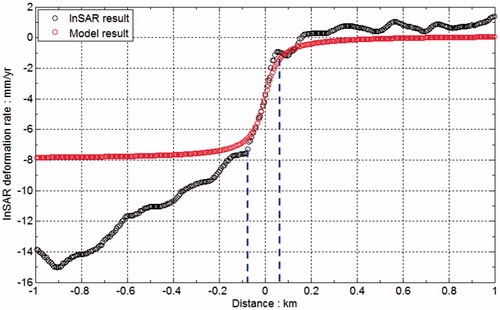
Figure 7. Profile of the deformation rate along P1–P1’ (shown in ). The blue dotted lines show the locations of faults. The grey shadow represents the terrain along the profile.
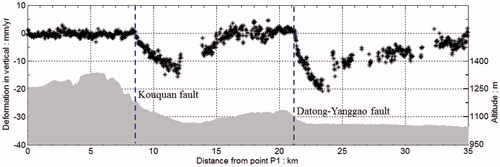
Figure 8. Observed, model, and residual rate maps. (a) Average deformation obtained from InSAR; (b) modelled deformation from the sill; (c) the residuals between the observations and the model.
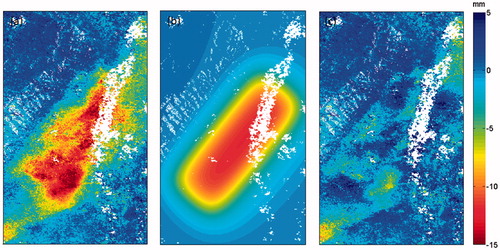
Table 2. Parameters for the best-fitting model sill. Uncertainties correspond to the 95% confidence level.
Figure 9. The distribution of GFs and hidden faults in Datong. The red dashed lines represent hidden faults, and the black dashed lines represent GFs. The blue line outlines the investigation area of hidden faults.
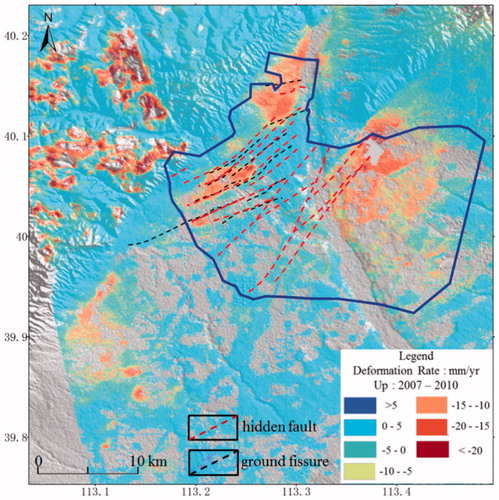
Figure 10. Profile of the deformation rate along P2–P2’ (shown in ). The blue lines show the locations of GFs. The numbers 1–5 represent the numbers of the GFs crossed by profile P2–P2’, as shown in .
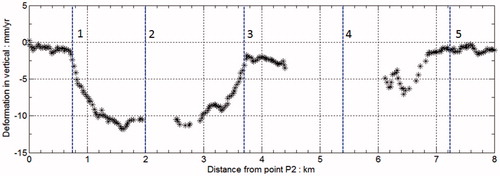
Figure 11. Comparison of GF activity between levelling and INSAR measurements. The red and blue circles represent InSAR-derived displacements on point S1 and point S2, respectively. The black circles show the cumulative deformation between S2 and S1. The purple squares represent the levelling measurements.
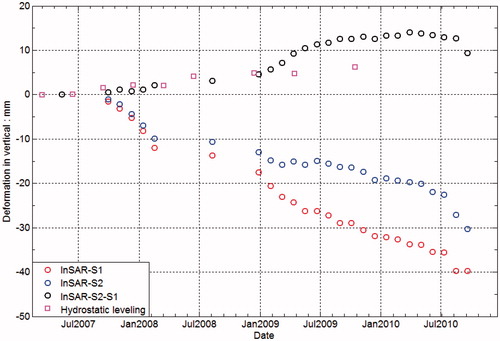
Figure 12. Deformation rate across the GF and the model result. The blue dotted lines indicate the extent (in distance) of the crack deformation gradient.