Figures & data
Figure 1. The red circle indicates the epicenter of the Chiloé earthquake. The blue circles show the epicenters of Mw ≥ 7 earthquakes that struck the coast of Chile in the recent years ().
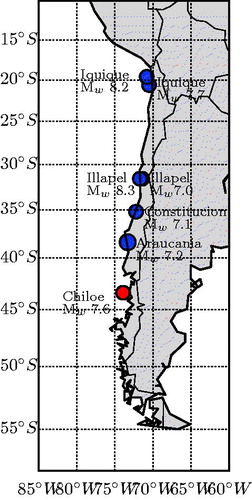
Table 1. List of M ≥ 7 earthquakes that occurred in Chile since 2011. The coordinates, the moment magnitudes and the depths were retrieved from the United States Geological Survey (USGS).
Figure 2. Dst, Kp and F10.7 indices during the month of December, 2016. The vertical red dashed line points to the day that the earthquake happened.
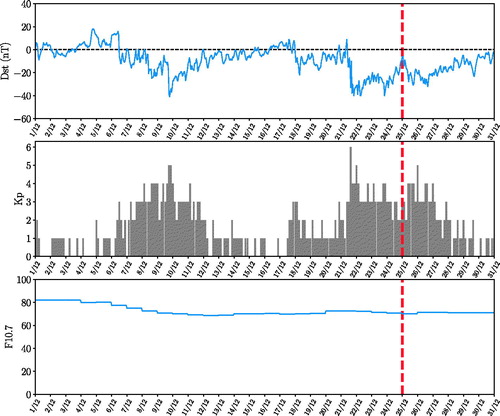
Figure 3. Differential VTEC maps for December 14, 2016. The grey circles indicate the epicenter of the Chiloé earthquake. The dashed red circles define the earthquake preparation region according to the Dobrovolsky equation (Dobrovolsky et al.Citation1979).
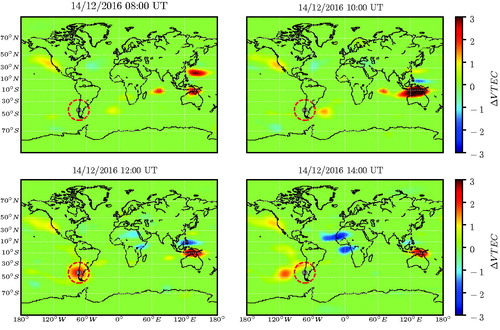
Figure 4. Differential VTEC maps for December 17, 2016. The grey circles indicate the epicenter of the Chiloé earthquake. The dashed red circles define the earthquake preparation region according to the Dobrovolsky equation (Dobrovolsky et al.Citation1979).
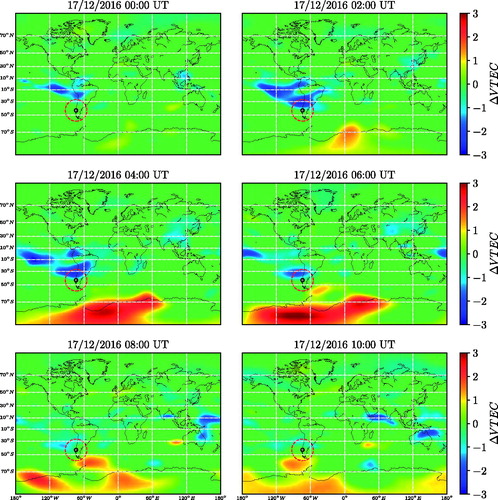
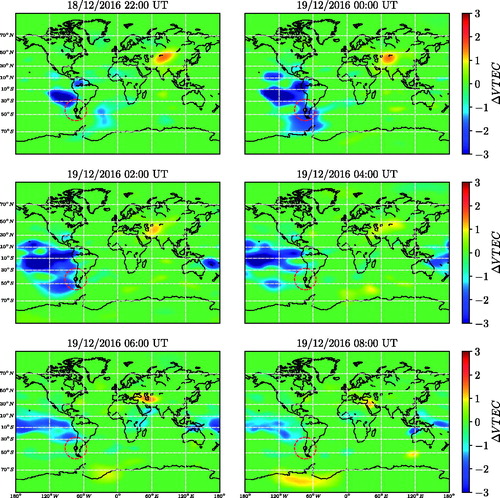
Figure 5. Differential VTEC maps for December 18 and 19, 2016. The grey circles indicate the epicenter of the Chiloé earhquake. The dashed red circles define the earthquake preparation region according to the Dobrovolsky equation (Dobrovolsky et al.Citation1979).