
Figures & data
Figure 1. Schematic diagram of the applied methodology.
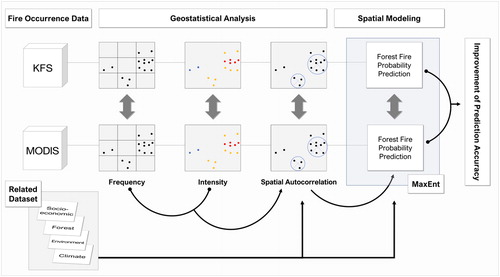
Figure 2. Study area with administrative boundaries and forest fire point data from two sources.
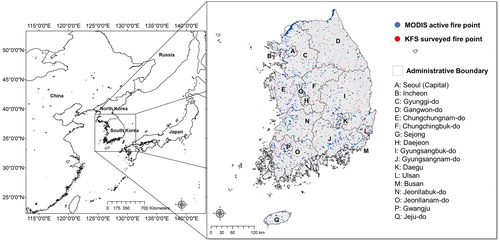
Table 1. Description of related factors used this study.
Figure 3. Forest fire occurrence frequency on a 5-km2 grid (a: MODIS active fire data and b: KFS fire survey data).
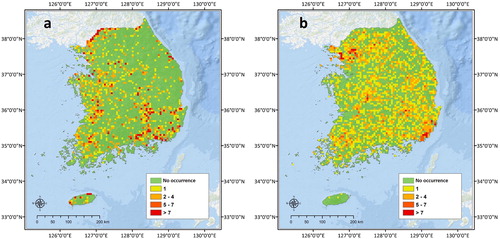
Figure 4. Forest fire hotspot analysis by fire intensity (a: MODIS active fire data and b: KFS fire survey data).
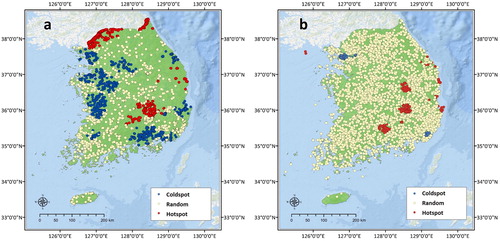
Figure 5. High-intensity forest fire hotspot analysis by fire intensity (a: MODIS active fire data and b: KFS fire survey data).
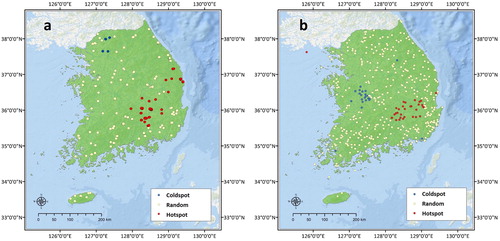
Figure 6. Spatial autocorrelation results by forest fire occurrence frequency (a: MODIS active fire data and b: KFS fire survey data). Note that the range and partial sill values are shown in m.
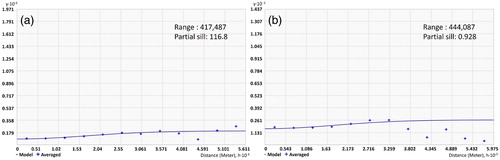
Figure 7. Spatial autocorrelation result by high-intensity forest fire (a: MODIS active fire data and b: KFS fire survey data). Note that the range and partial sill values are shown in m.
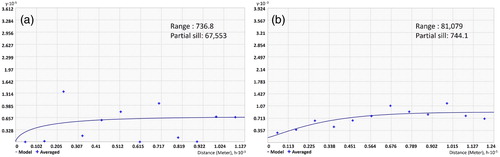
Figure 8. Spatial autocorrelation results by related factors for the MODIS active fire point data (a: rainfall, b: temperature, c: effective humidity, d: maximum wind speed, e: forest type, f: national protected area, g: population density, and h: distance from road). Note that the range and partial sill values are shown in m.
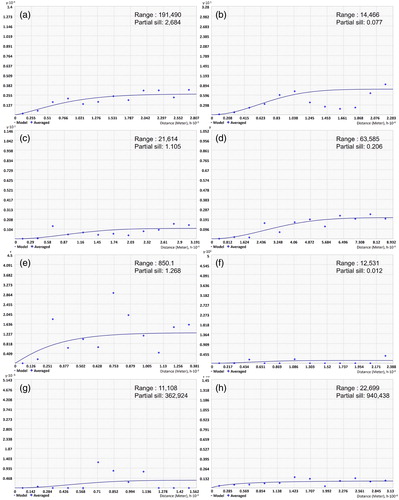
Figure 9. Spatial autocorrelation results by related factors for the KFS surveyed fire point (a: rainfall, b: temperature, c: effective humidity, d: maximum wind speed, e: forest type, f: national protected area, g: population density, and h: distance from road). Note that the range and partial sill values are shown in m.
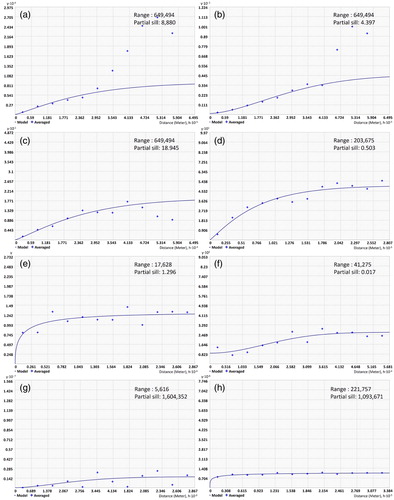
Figure 10. Spatial modeling results of forest fire occurrence probability (a: MODIS active fire data and b: KFS fire survey data).
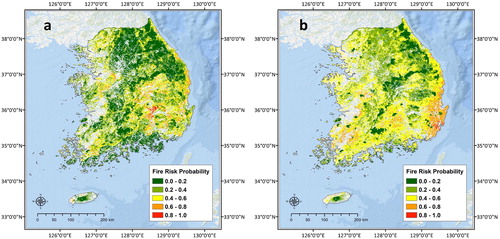
Figure 11. Evaluation of spatial modeling performance for forest fire occurrence probability using ROC and AUC (a: MODIS active fire data and b: KFS fire survey data).
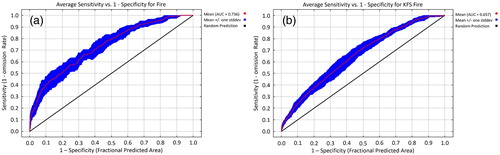
Table 2. Analysis of factor contributions for spatial modeling of fire occurrence probability (%).