Figures & data
Figure 1 Grass type and distribution of meteorological stations over the QTP.
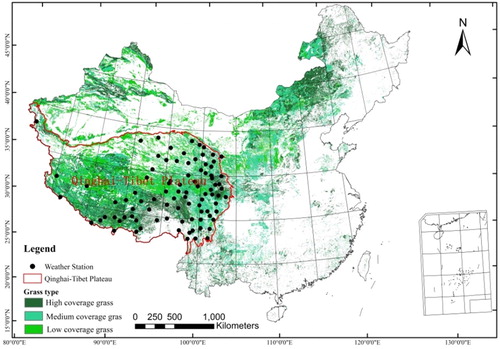
Figure 2 Snow disaster risk system.
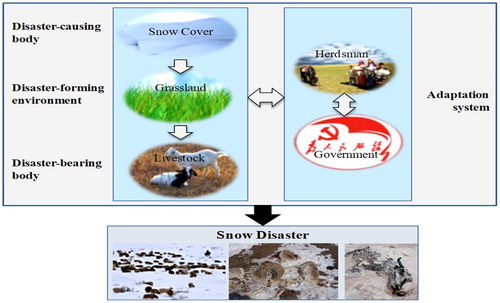
Table 1. The assessment system of integrated risk index of the SD in the QTP.
Figure 3 Losses caused by the SD and accumulative snow depth (b) change in the QTP during the period 1961–2015 (recorded livestock deaths with over 0.60 million is considered as large-scale Losses, yet lower 0.60 million is small-scale losses).
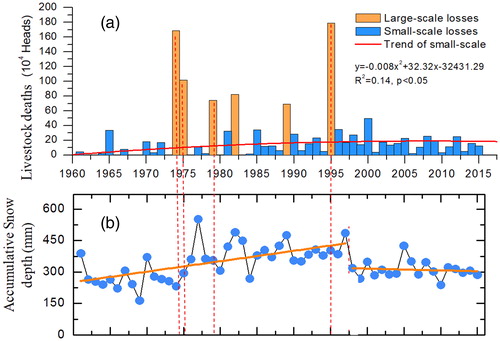
Figure 4 Annual accumulated snow depth, snow cover day and number of days (a) below 0 °C and mean NDVI change during growing season (May-September) in the QTP (Dotted line for linear fitting trend).
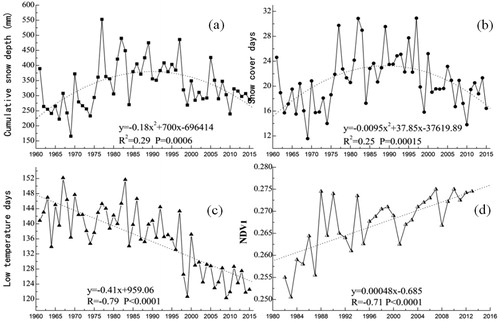
Figure 5 Spatial distribution of accumulated snow depth (a), snow cover days (b), the days below 0 °C (c) and grass yield (d) in the QTP (Note: all the values are dimensionless and are normalized into 0-1).
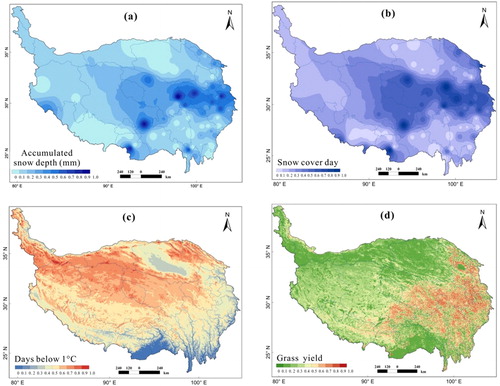
Figure 6 The spatial distribution of hazard index (HI) of the SD in the QTP. (Note: all the values are dimensionless and are normalized into 0-1).
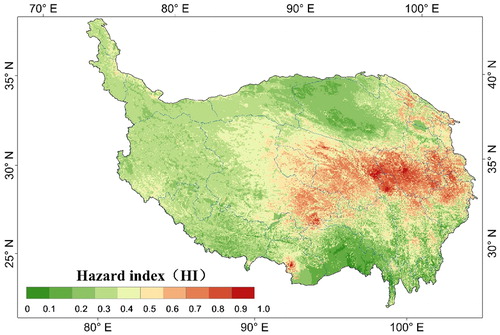
Figure 7 Spatial distribution of livestock overloads rate reflecting animal husbandry exposure in the QTP.
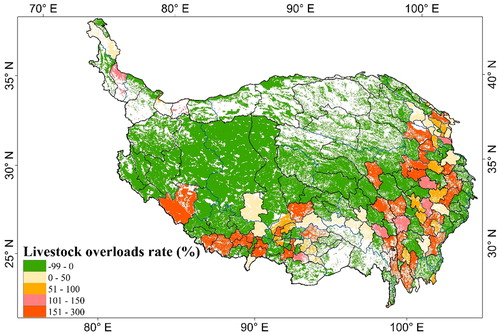
Figure 8 Spatial distribution of livestock vulnerability facing to SD in the QTP.
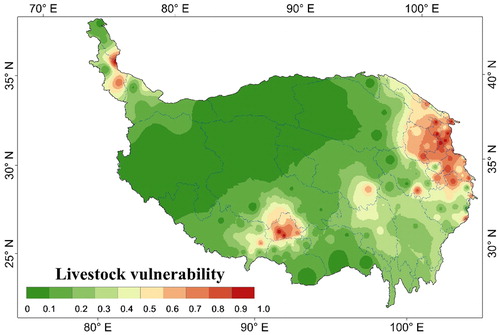
Figure 9 Spatial distribution of per capita income (a), fixed asset investment (b), and adaptability index (AI) (c).
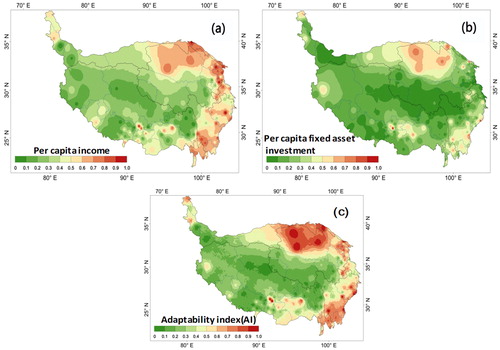
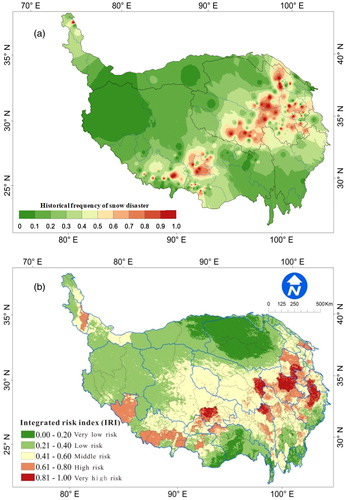
Figure 10 Classification, zoning and spatial distribution of historical SD (above map) and integrated risk index (IRI) of the SD (under map) in the QTP.