Figures & data
Figure 1. (a) South India showing the state of Kerala (mosaic of SRTM 90 m resolution DEM) (b) and (c) UAV images of flooding event along Periyar river course (Source: I&PRD, Govt of Kerala).
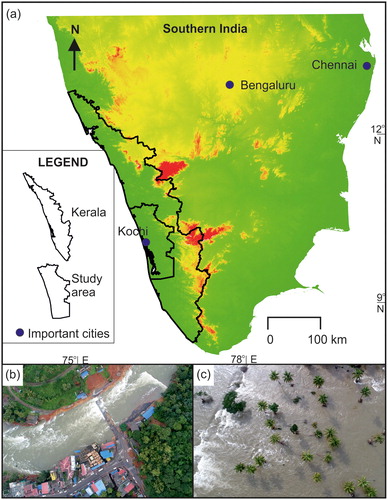
Figure 2. Hyetograph of Kerala from 2010 to 2018 (up to 29 August).
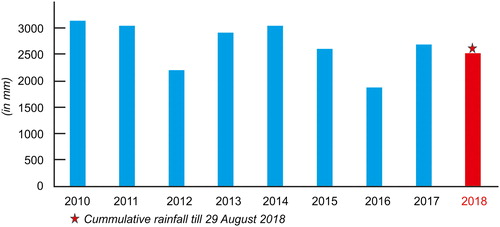
Figure 3. (a) Sentinel 2 image showing the water bodies of the study area before the flood event (b) Flood inundation map prepared from the water pixels of Sentinel 1 image of 21 August 2018 (c) Changes between the pre-event and the flood inundation map of the study area.
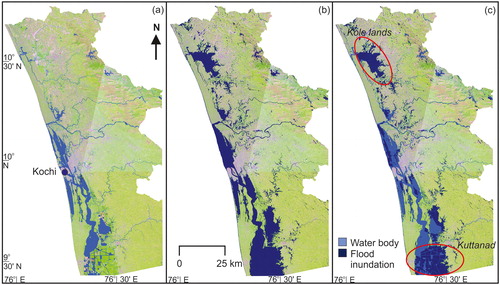
Figure 4. (a) DEM of the area showing pre-flood and flood, (b) flood inundation at Kole lands of Thrissur. Note the 10 m rise in water level during flooding and (c) flood inundation at Kuttanad. Note the 5 m rise in water level during flooding.
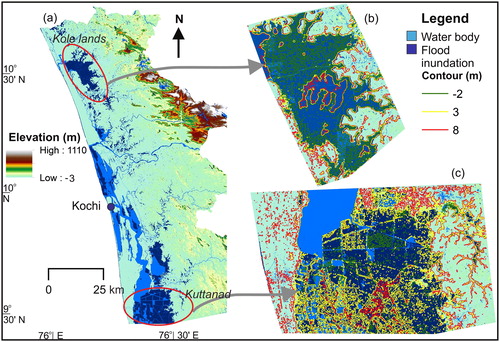
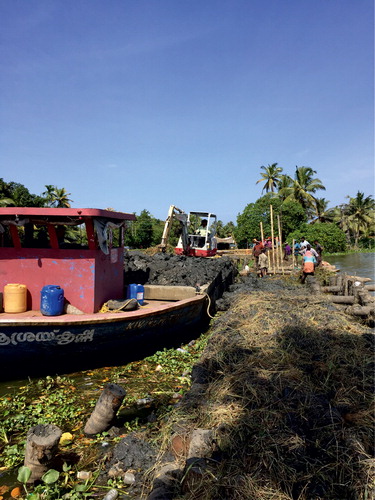
Figure 5. View of the bund reconstruction efforts that secures Kanakassery, Valiyakari, and Meenapally paddy polders from the Vembanad Lake in Kuttanad. The left of the bund is the Vembanad Lake and the right of the bund is the paddy polders that span over 750 acres.