Figures & data
Figure 1. Location of the study area in relation to KSA and the western region (modified from Abdulrazzak et al. Citation2018b).
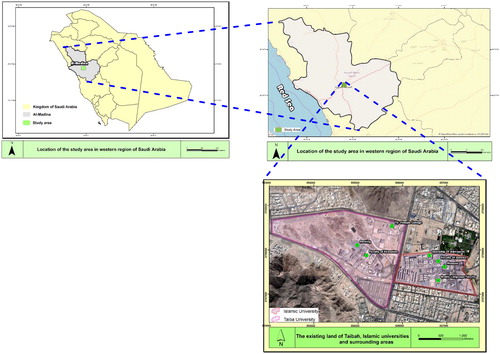
Figure 2. Watershed delineation and stream network projected on a topographic map (a), and the land use and land cover map of the watershed based on a remote sensing technique for the estimation of CN (b).
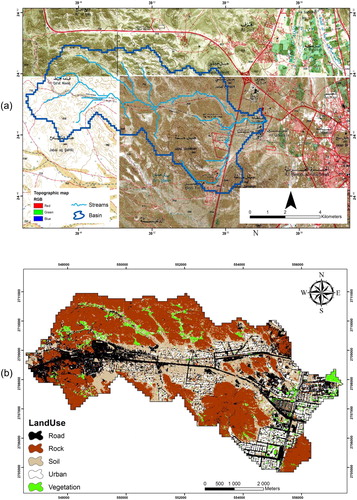
Table 1. Geometric and morphological parameters.
Table 2. Computed composite SCS-CN for the watershed.
Figure 3. Rainfall stations in the study area: M001 and M103.
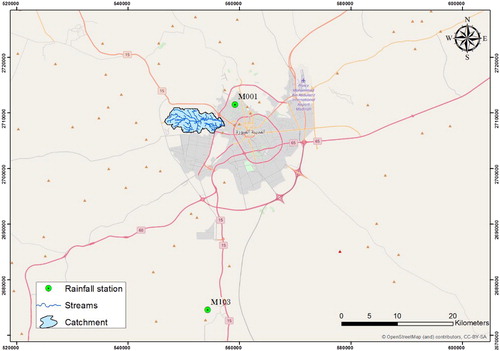
Figure 4. Fitting probability distributions to the maximum daily rainfall: a left column for station M001 and a right column for station M103.
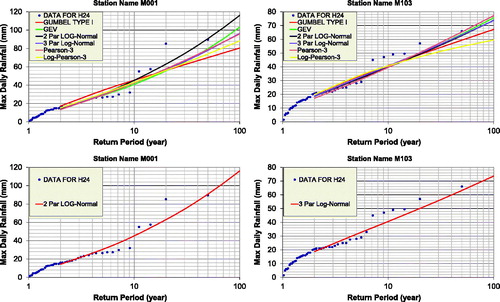
Figure 5. Results of the rainfall–runoff model (HEC-HMS): (a) cumulative rainfall distribution for 3-h duration and (b) the corresponding hydrographs for different return periods.
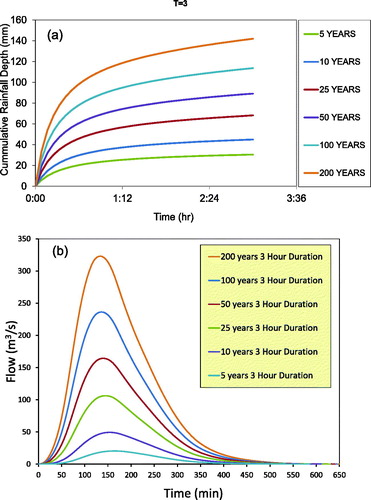
Table 3. RMSE for theoretical statistical distributions used to fit the rainfall data (modified from Abdulrazzak et al. Citation2018b).
Table 4. Design rainfall for the study area.
Table 5. Summary of rainfall–runoff model based on the HEC-HMS simulation.
Figure 6. Results of flooding from a 2D HEC-RAS model: Taibah (left images) and Islamic (right images) universities.
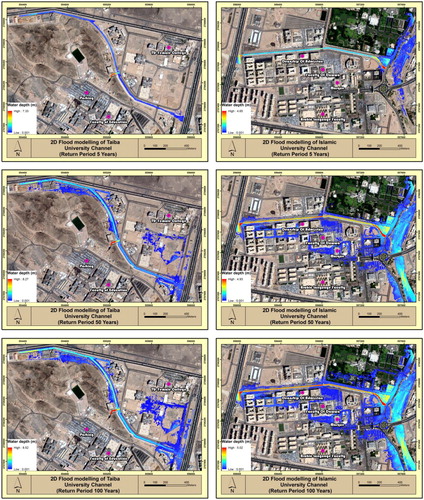
Table 6. Flood risk matrix.
Figure 7. Application of the flood risk matrix based on the flooding in the TU (left images) and IU (right images) catchment.
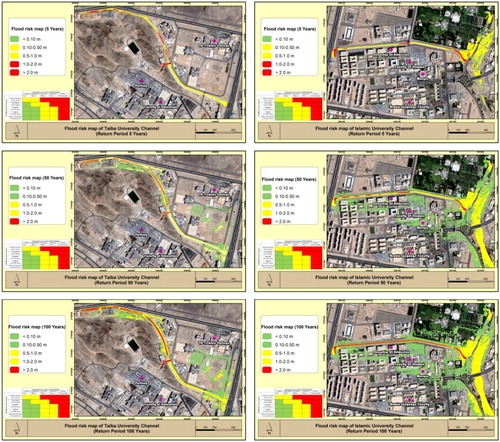
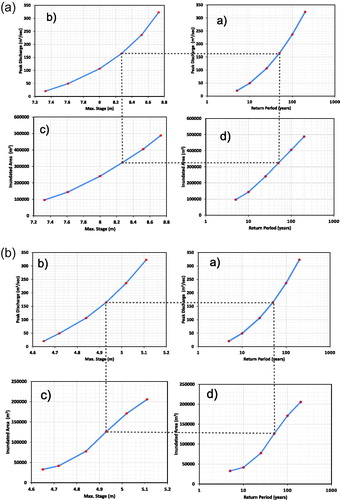
Figure 8. (a) Quantitative summary of risk results for the TU channel. The logic for risk assessment in this figure flows counterclockwise starting from (a) and ending at (d). (b) Quantitative summary of risk results for the IU channel. The logic for risk assessment in this figure flows counterclockwise starting from (a) and ending at (d).