Figures & data
Figure 1 shows the number of missing people, deaths, and direct economic losses due to geological disasters from 2012 to 2016 in China (http://www.mlr.gov.cn/). Source: Derived from “China’s Land and Resources Bulletin”
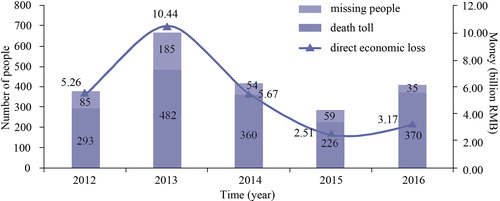
Figure 2 Geographical location of the study area.
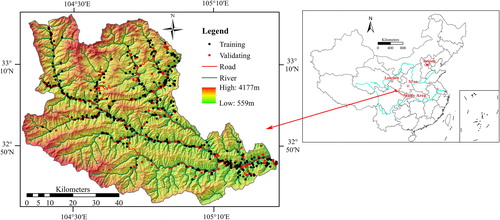
Figure 3 Landslide conditioning factor maps showing: (a) slope angle, (b) altitude, (c) NDVI, (d) distance to faults, (e) distance to roads, (f) distance to rivers, (g) rainfall, and (h) lithology.
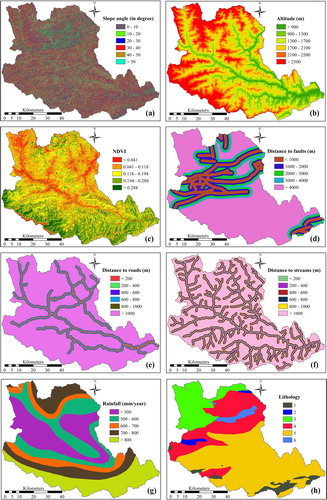
Table 1. Lithologies of the geological unit in the study area (Xie Citation2013).
Table 2. Spatial relationship between each conditioning factor and landslide using IV, WofE, and CF methods.
Figure 4 Landslide susceptibility map produced using the information value method.
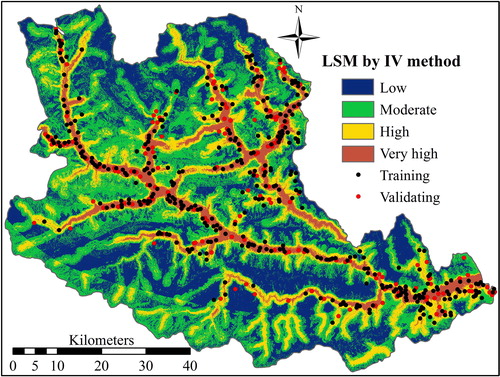
Figure 5 Landslide susceptibility map produced using the weights-of-evidence method.
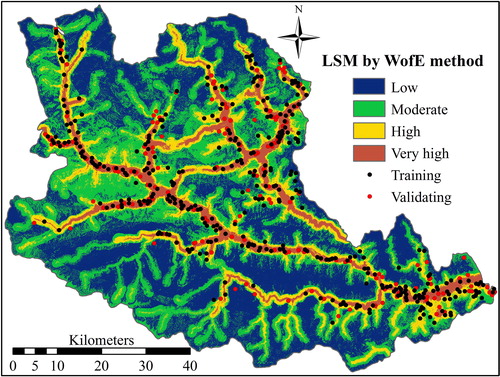
Figure 6 Landslide susceptibility map produced using the certainty factor method.
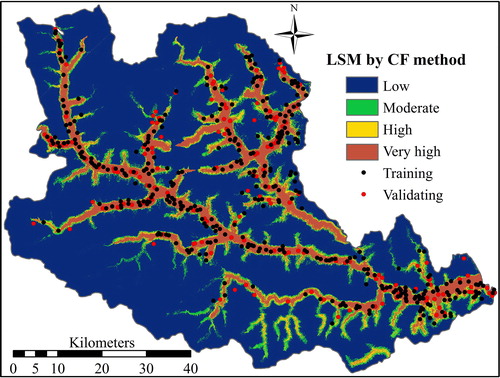
Figure 7 Graph showing landslide susceptibility classes delimited by method.
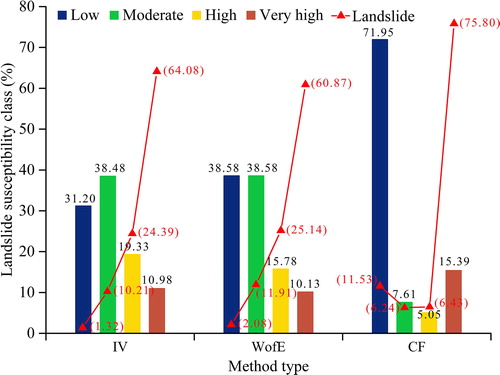
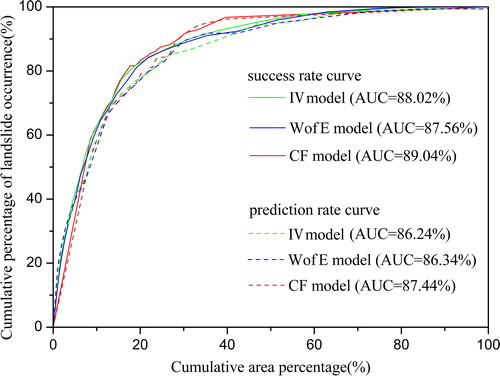
Figure 8 Success rate and prediction rate curves for each susceptibility map.