
Figures & data
Figure 1 Case study area. Source: Author
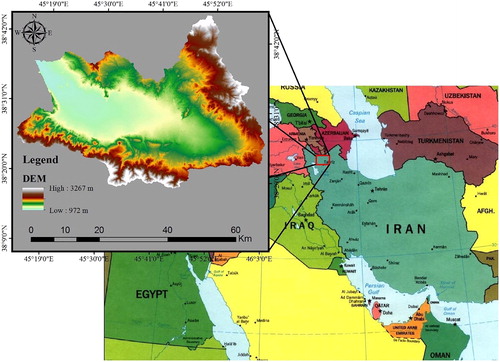
Figure 2 Map of the LULC classification of the studied area. Source: Author
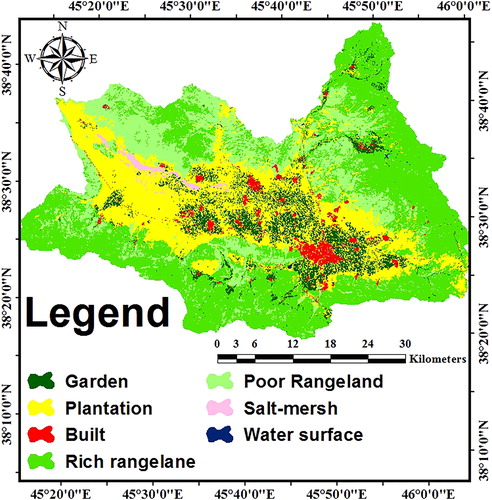
Figure 3 Map of soil hydrological groups of the studied area. Source: Author
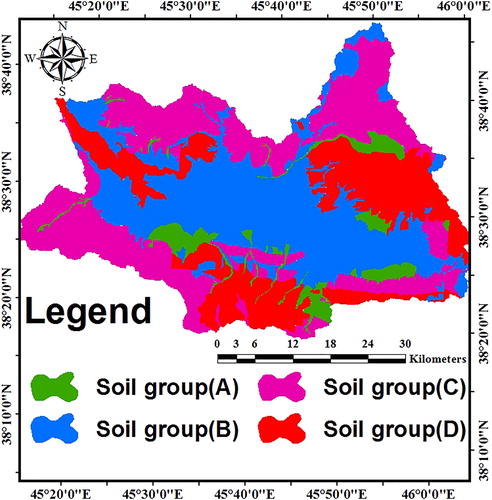
Figure 4 Map of the DEM classes. Source: Author
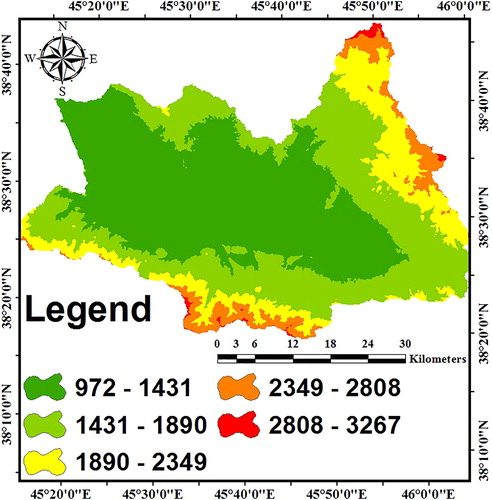
Figure 5 Slope. Source: Author
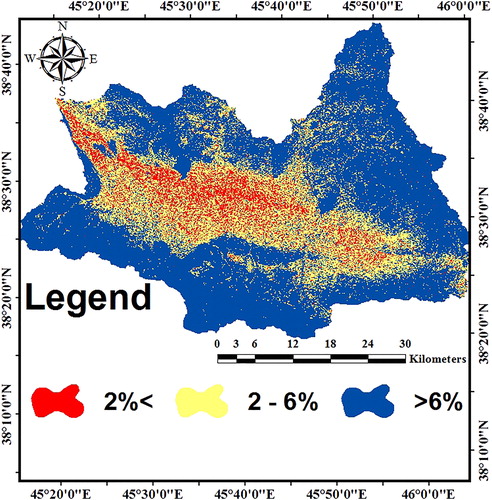
Table 1. Maximum rainfall intensity of 1 hour.
Table 2. Runoff coefficients determination.
Figure 6 LULC risk level assessment flowchart.
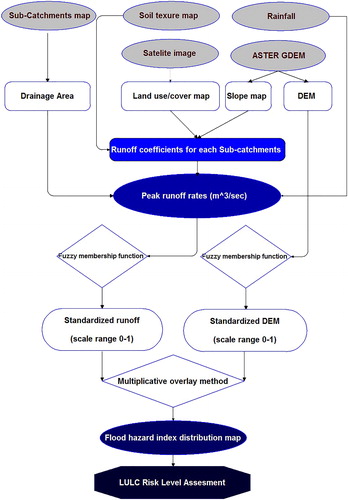
Figure 7 Map of the case study sub-basins. Source: Author
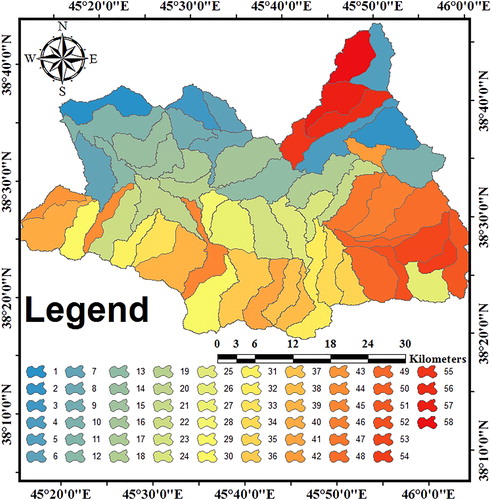
Figure 8 The area runoff coefficient map. Source: Author
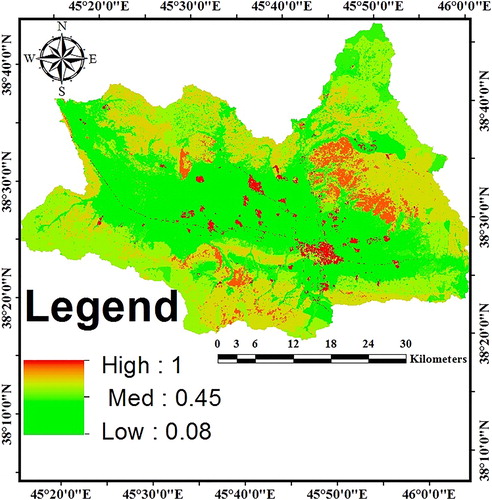
Figure 9 Runoff coefficient of each sub-basin. Source: Author
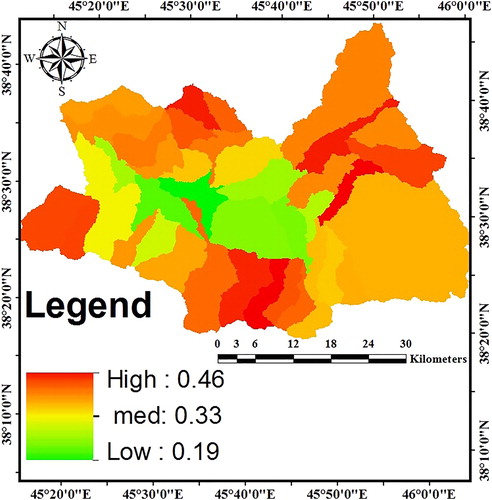
Table 3. The peak runoff.
Figure 10 The fuzzy map of DEM. Source: Author
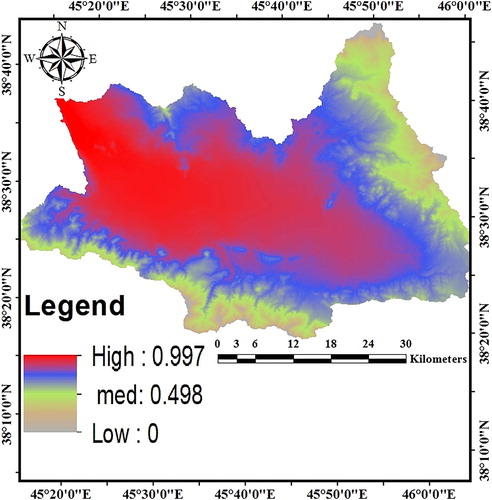
Figure 11 The fuzzy map of peak runoff. Source: Author
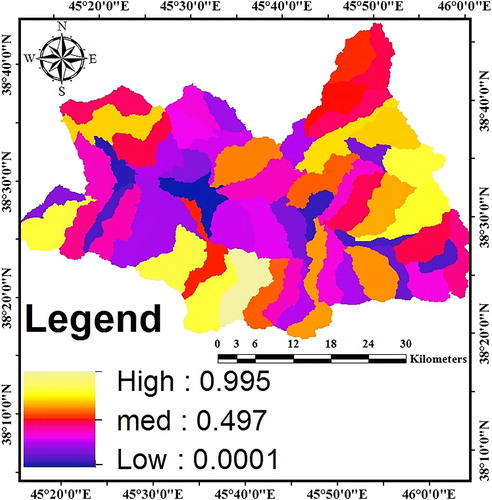
Figure 12 Flood hazard map. Source: Author
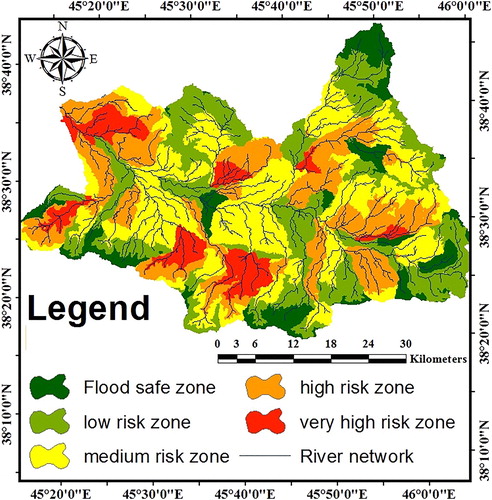
Figure 13 Map of the marked points with GPS devise. Source: Author
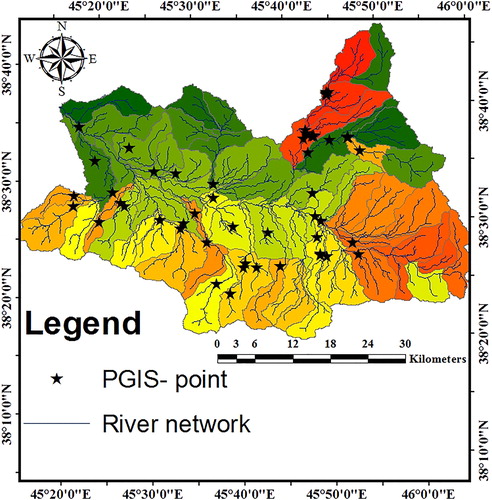
Table 4. Confusion matrix estimating the accuracy of hazard maps.
Table 5. Area of each LULC in flood risk classes.
Table 6. Area of high and very high risk categories of LULC.