Figures & data
Figure 1. (a) Location of PRD area (northern Italy). (b) Regional boundaries and studied coastal area, corresponding to about 200 km2 (dashed yellow line). (c) Orthophoto of study area from aerial photogrammetric survey of 2014, and indication of the nine sub-areas (dashed red lines, from 1 to 9: 1 – Sacca di Goro; 2 – Sacca degli Scardovari; 3 – Bacino Bonelli Levante; 4 – Sacca del Canarin; 5 – Laguna Basson; 6 – Laguna del Burcio; 7 – Laguna di Barbamarco; 8 – Laguna Vallona; 9 – Isola di Albarella). Source: Author
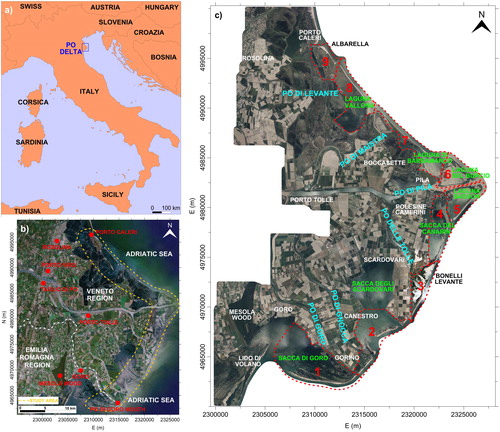
Table 1. Main characteristics of aerial photogrammetric surveys used in this study: (1) 1944 survey performed by British Royal Air Force (RAF) with two cameras: photo size 24 × 24 cm, focal length 24 inch; photo size 18 × 24 cm, focal length 20 inch; (2) 1955 survey carried out by Gruppo Aereo Italiano (GAI) from 1 June to 22 July; (3) that of 1962 between 8 and 11 July; (4) that of 1977 on 10 October; (5) that of 1999 on 10 September: these data are available from IGMI; (6) 2008 survey performed between 21 and 22 August 2008 (data from Veneto Region); (7) 2014 survey performed by BLOM CGR with digital camera Vexcel UltraCam-Xp, image size 11,310 × 17,310 pixel, focal length 100.5 mm.
Table 2. Comparisons between coordinates of 100 homologous natural points, manually measured with stereoscopic viewing on models (E = East; N = North).
Figure 2. Orthophotos of PRD coastal area obtained from seven multi-temporal aerial photogrammetric surveys: (a) 1944, (b) 1955, (c) 1962, (d) 1977, (e) 1999, (f) 2008 and (g) 2014. Source: Author
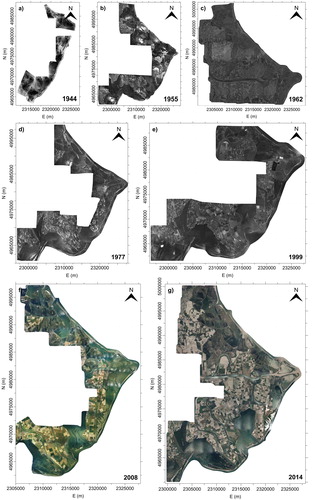
Figure 3. Coastlines obtained from aerial photogrammetric surveys performed in 1944 (green), 1955 (red), 1962 (magenta), 1977 (yellow), 1999 (cyan) and 2008 (blue) overlapped on the orthophoto generated from the 2014 one. Details A, B, C show relevant changes in multi-temporal analysis. Source: Author
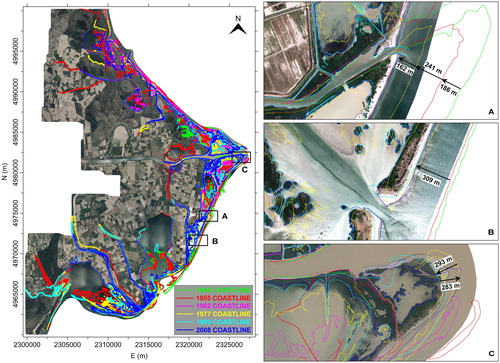
Figure 4. Multi-temporal orthophotos (a: 1944, b: 1955, c: 1977, d: 1999, e: 2008, f: 2014) and trend of emerged surfaces (g) of Bonelli Levante basin (sub-area 3): 10 November 1957 storm was intercepted in the comparison between 1955 and 1977 orthophotos (b), (c): area was reduced in size by about 5.69 Mm2 (g). Source: Author
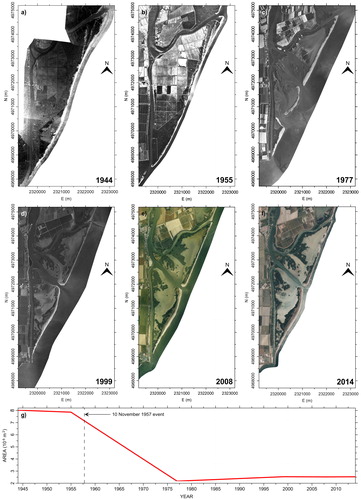
Table 3. Averages and standard deviations of sub-aerial surfaces measured by five operators, in identical conditions, for the nine sub-areas of 1955 and 2008 photogrammetric models.
Table 4. Comparisons between measured emerged surfaces on subsequent photogrammetric surveys for the nine sub-areas of .
Figure 5. Trend of emerged surfaces of the nine sub-areas of Figure 1 (continuous and dashed blue, red, green, yellow and cyan lines): data match large submerged areas together with highest available land subsidence values (period 1955–1977), and reduced values for last periods (1977–2014, except area 1). Source: Author
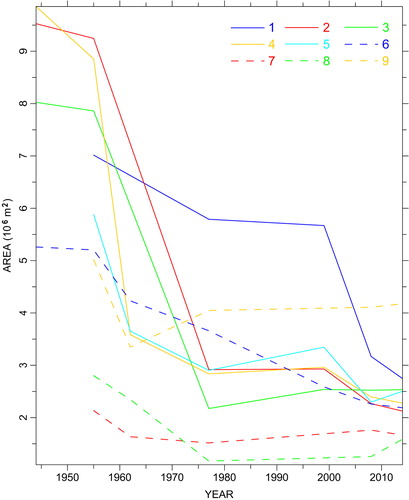
Figure 6. Velocities map along the LOS of satellite obtained from processed Sentinel-1A images (data from 17 November 2014 to 17 May 2017) overlapped on the orthophoto of PRD extracted from the aerial photogrammetric survey performed in 2008 (from Fiaschi et al. Citation2018, modified).
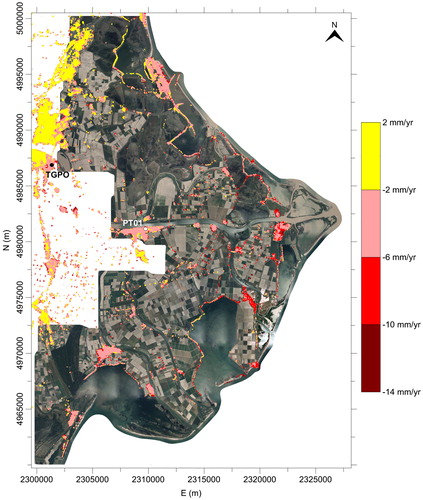
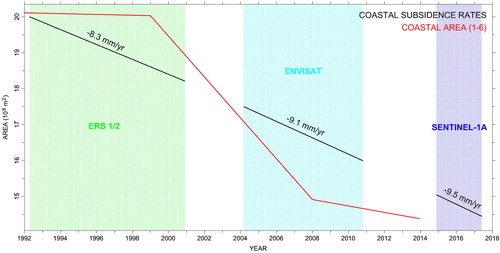
Figure 7. Land subsidence rates along the LOS of satellite in the PRD coastal area obtained averaging the ADInSAR points closer to the coastline (ERS 1/2 from 10 May 1992 to 13 December 2000 in green, ENVISAT from 17 March 2004 to 22 September 2010 in cyan and Sentinel-1A from 17 November 2014 to 17 May 2017 in blue) together with the emerged surfaces of the six sub-areas (from 1 to 6) with complete data from 1992 to 2014 (1999 survey is limited in the northern portion, without data of emerged surfaces for sub-areas 7, 8, 9, ). Source: Author