Figures & data
Figure 1. Twin cyclones Bansi and Chedza hitting Madagascar East coast on 16 January 2015 (a) (modified after European meteorological satellite EUMESAT image; available at: www.eumetsat.int); aerial pictures of the triggered shallow landslides within the city on March 5th event (b, c) (BNGRC - Bureau National de Gestion des Risques et des Catastrophes; http://www.bngrc.mg).
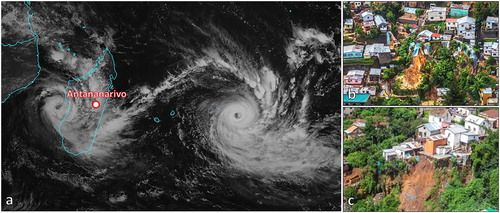
Figure 2. Location of Antananarivo on Madagascar Google Earth image (a); detail of the Antananarivo area on optical satellite image (b) (the red polygon represents the Unesco buffer zone). Source: Author
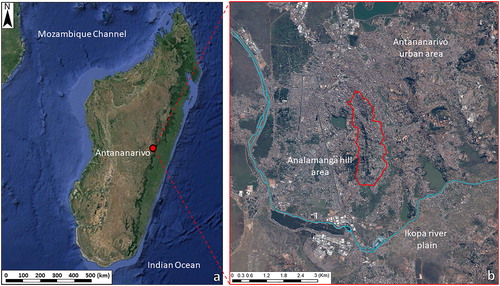
Figure 3. The Antananarivo Upper Town Cultural Heritage buildings: Rova palace complex lithographs and historical pictures (a–c; Courtesy of IMV-Institut des Métiers de la Ville-Tana City Lab; https://www.imvtana.org); current picture of the rebuilt structure following the 1995 fire; Rova palace (d), royal chapel (e). Andafiavaratra palace (f); Andohalo Cathedral (g). Source: Author
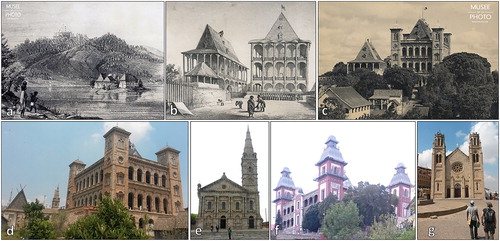
Figure 4. Spaceborne ortophoto (Pleiades satellite) of the town sectors showing the Upeer Town quarters (a) (in red the boundary of the Unesco Buffer zone). Panoramic views of the Upper-Middle town and Analamanga hill eastern (b) and western slopes (c). View of the Lower Town area (d). Source: IMV-Institut des Metiers de la Ville-Tana City Lab by its manager Tamara Teissedre-Philip ([email protected]).
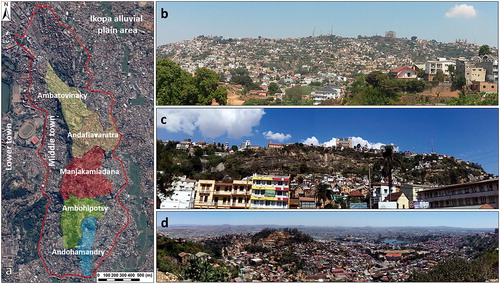
Figure 5. Workflow of the applied methodology.
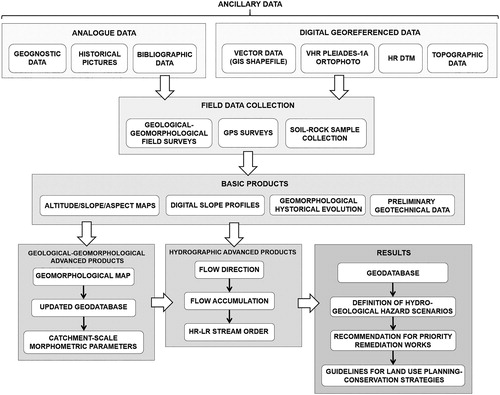
Figure 6. Analamanga hill DEM altitude map (the black boundary represents the UNESCO buffer zone), including with E-W (1–5) and N-S (6) profiles. Source: Author
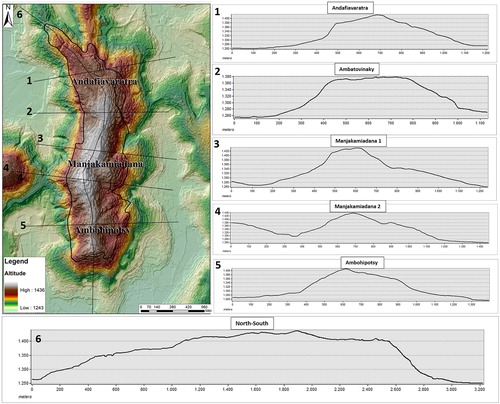
Figure 7. Analamanga hill DEM slope map (a), and the related geology (arrows show the outcrops): (b) granite western slope rock wall; (c) laterite soils (d: detail); (e) slope eluvial-colluvial deposits (f: detail); (g) alluvial deposits. Source: Author
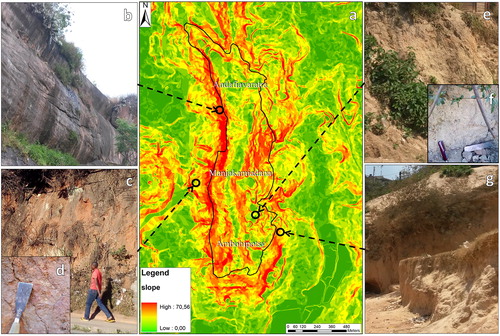
Figure 8. Geological-geomorphological map of Analamanga hill. Source: Author
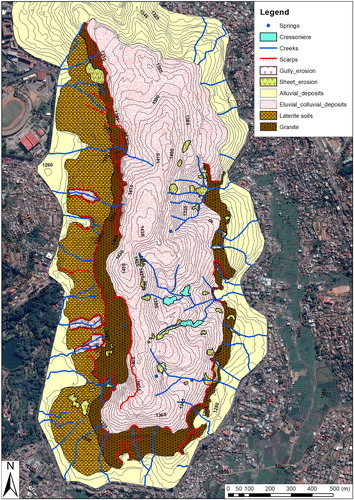
Figure 9. Hydrographic network (in blue) and hydrographic basins (in red) of the Analamanga hill. Source: Author
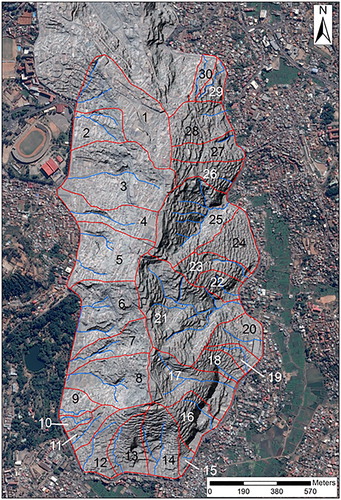
Table 1. Characteristics of the mapped creeks.
Table 2. Stream orders data.
Figure 10. Analamanga hill hydrographic map by using the 2 m resolution DEM (on the left) and the LiDAR (on the right). Source: Author
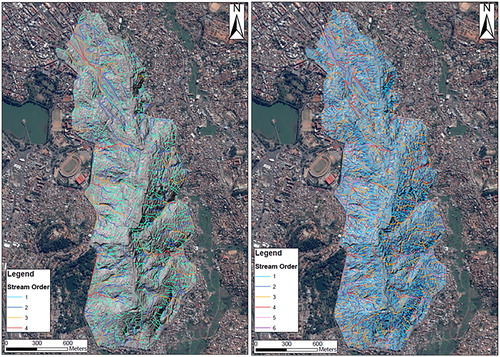
Figure 11. Maps of Basins 3–4 and 25. Green lines mark the roadways and paths. Source: Author
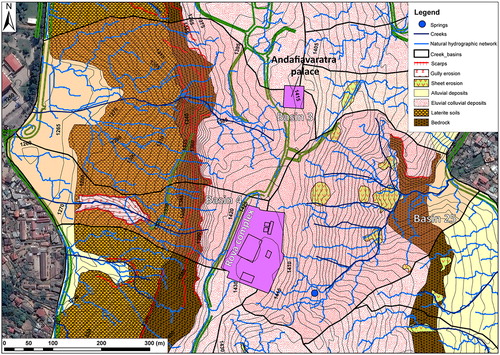
Figure 12. Geomorphological-erosional problems in basins 3–4. Hanging-like valley (a); damaged buildings (red square 1), retained roadway slope (red square 2). Creek 3 hydraulic narrowing (b). Creek 4 lavaka-like gully erosion (c) and hovels built within the creek bed (d). Basin 25 urbanization (e). Source: Author
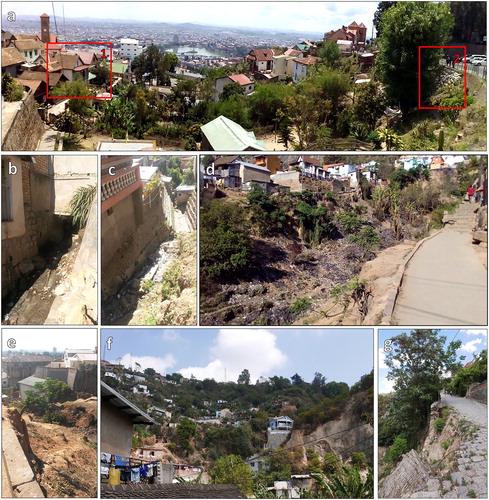
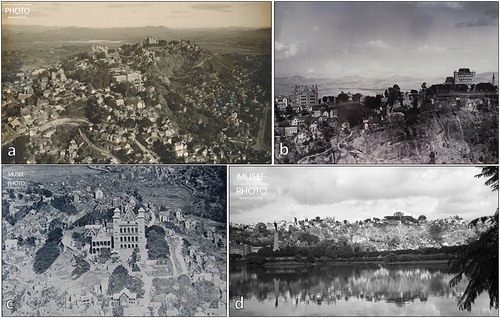
Figure 13. Historical aerial (a–c) and terrestrial (d) pictures of the Rova complex (first half of the twentieth century) and the surrounding Analamanga hill slopes. The comparison with the current setting of the Analamanga hill () shows the evidence of the progressive deforestation and increase of urbanization of the Upper and Middle town. Source: Author