Figures & data
Figure 1. Geographical localization of Basilicata region (left) and study sites (right).
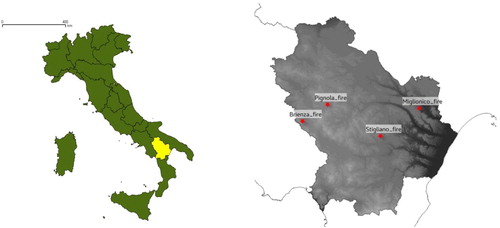
Figure 2. (a) Geological sketch map of the Southern Apennines and surrounding areas; (b) geological cross-section (from Piedilato and Prosser Citation2005).
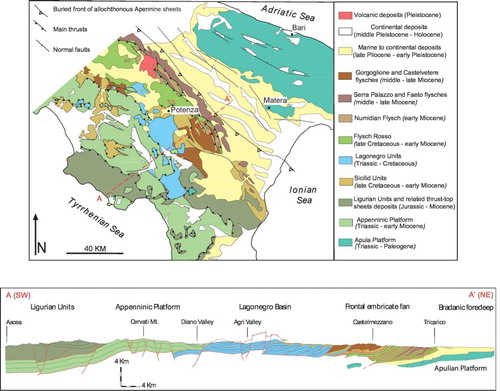
Figure 3. Soil erosion after wildfire (Pisticci, Basilicata).
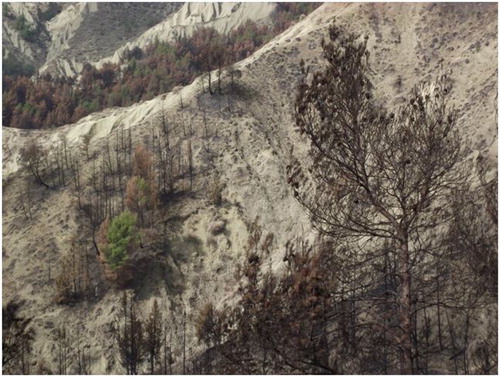
Figure 4. Miglionico fire aerial image. (source: Civil Protection Department - Basilicata Region).
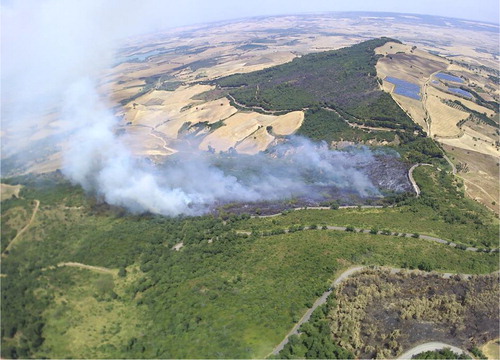
Figure 5. Stigliano fire aerial image. (source: Civil Protection Department - Basilicata Region).
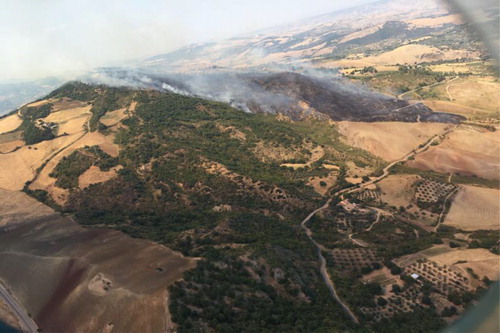
Figure 6. Rifreddo fire aerial image. (source: Civil Protection Department - Basilicata Region).
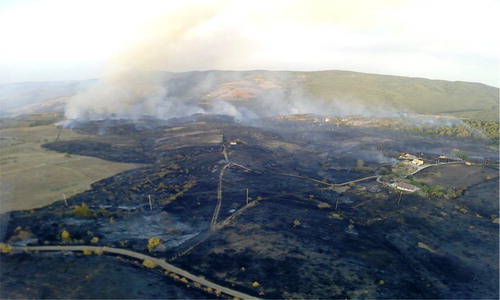
Table 1. Sentinel-2 overview.
Figure 7. Sentinel-2 Multispectral Instrument (MSI) imagery (26 August 2017). True-colour composite of Red, Green and Blue bands in Bottom-of-Atmosphere reflectance data.
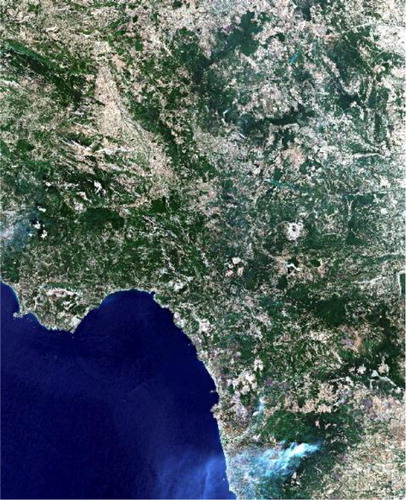
Table 2. Spatial datasets sources used for the five RUSLE factors.
Table 8. Range and Mean of RUSLE factors and soil loss prediction.
Figure 8. Landsat image (left) acquired on 13 August 2015 (RGB 321) and Vegetation Map (right).
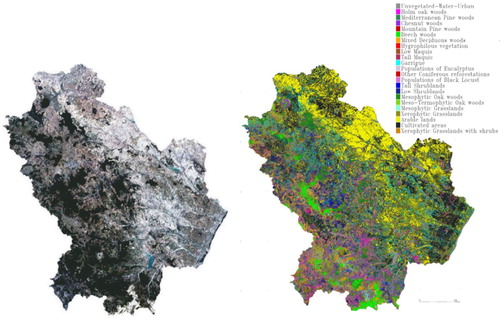
Table 3. Fire events and Sentinel-2 data.
Figure 9. Miglionico fire. Upper: Sentinel-2 image (pre-fire); Sentinel image (post-fire). Lower: dNBR; dNBR (range).
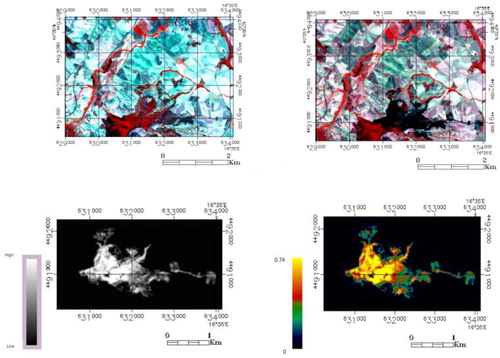
Figure 10. Rifreddo fire. Upper: Sentinel-2 image (pre-fire); Sentinel image (post-fire). Lower: dNBR; dNBR (range).
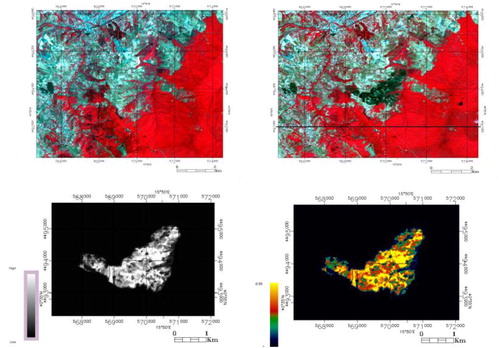
Figure 11. Stigliano fire. Upper: Sentinel-2 image (pre-fire); Sentinel image (post-fire). Lower: dNBR; dNBR (range).
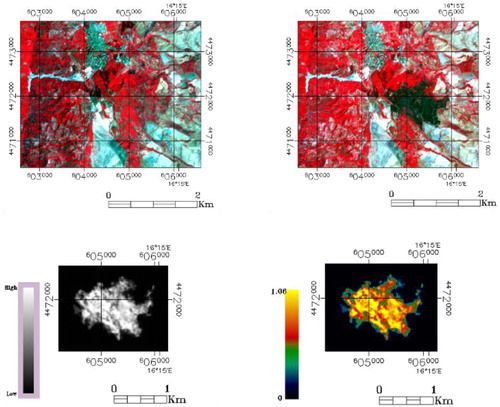
Figure 12. Brienza fire. Upper: Sentinel-2 image (pre-fire); Sentinel image (post-fire). Lower: dNBR; dNBR (range).
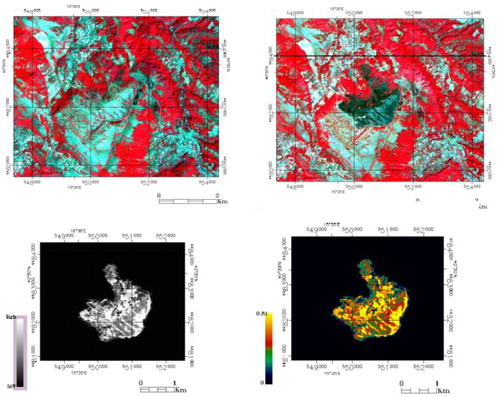
Table 4. Burned surface distribution per fire severity class.
Figure 13. Fire-modified RUSLE factors maps of Brienza (left) and Miglionico (right).
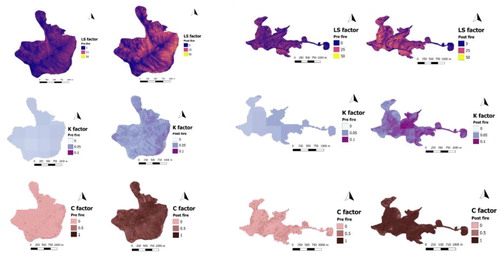
Figure 14. Fire-modified RUSLE factors maps of Stigliano (left) and Rifreddo (right).
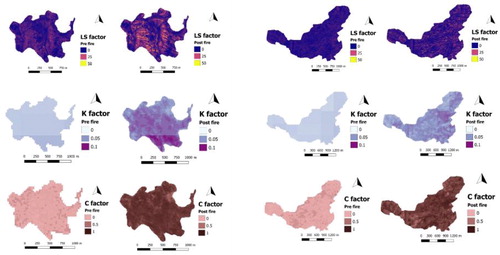
Figure 15. Pre-fire (left) and post-fire (right) RUSLE A value. From the top to bottom: Miglionico, Rifreddo, Stigliano, Brienza. Values are expressed in Mg ha−1 yr−1.
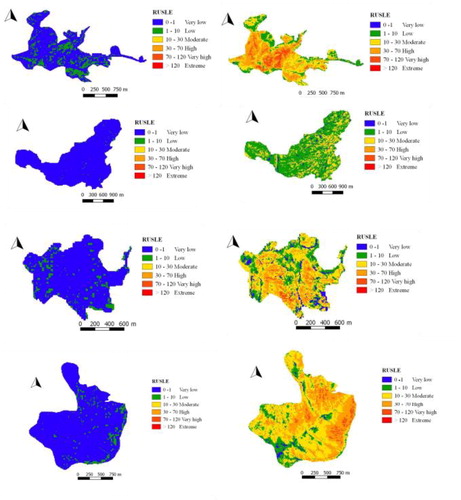
Table 5. Pre-fire and post-fire erosion range distribution – RUSLE classes in Mg ha−1yr−1.
Table 6. Estimated soil losses per year for the studied sites before and after fire (1st year).
Table 7. Average RUSLE A pre-fire and first year post-fire.
Table 9. Comparison between average post-fire RUSLE for all severity classes and average post-fire RUSLE A for fire severity class ‘High’.
Figure 16. dRUSLE-dNBR linear regression analysis. dRUSLE (Mg ha−1 yr−1) is the difference between RUSLE A post-fire and RUSLE A pre-fire.
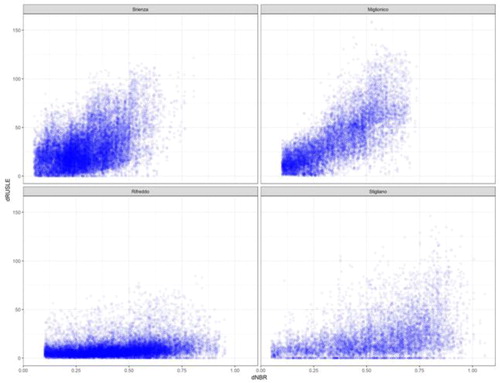
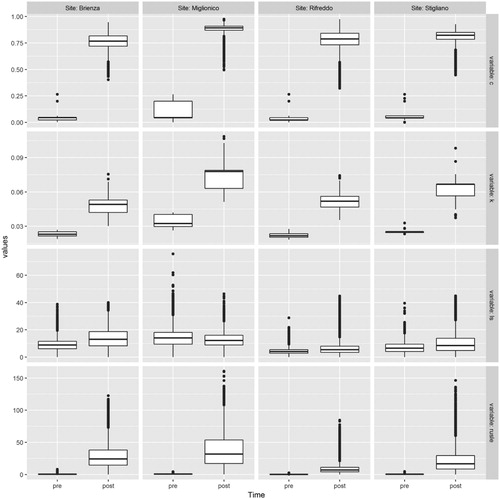
Figure 17. Data distribution for C, K, LS and pre- and post-fire RUSLE-estimated erosion (Mg ha−1 yr−1) for each site. The bottom, the centre and the top of the boxplots represent, respectively, the first, the second and the third quartile of the data distribution. The whiskers extend 1.5 times the interquartile range (IQR).