
Figures & data
Figure 1. Location and satellite data of the study area: (A) the intersection between the Heilongjiang River and Songhua River; (B) the Huaihe River downstream canal zone; (C) the Huaihe River Huainan region; (D) the East Taihu Lake region; (E) the Yangtze River Hukou below the mainstream region; (F) the North Poyang Lake region; (G) the South Poyang Lake region; and (H) the Huizhou Dongjiang region.
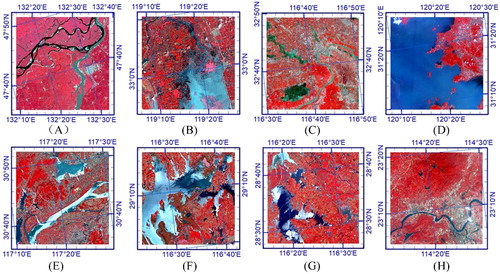
Table 1. Selected eight study areas and GF-1 satellite images.
Figure 2. Flow chart of scaling method based on mechanism.
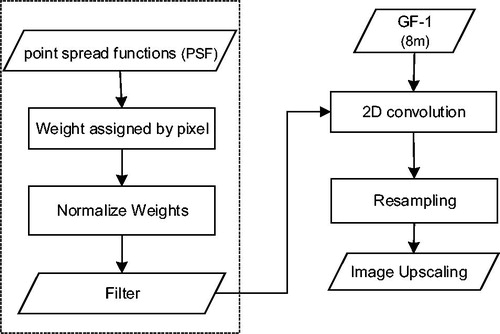
Figure 3. Different spatial resolution series images of study area C (C-1: 8 m, C-2: 24 m, C-3: 40 m, C-4: 56 m, C-5: 120 m, C-6: 152 m, C-7: 200 m, and C-8: 248 m).
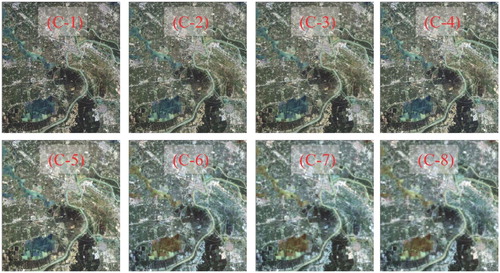
Figure 4. The results of water extraction from different spatial resolution images of C study area (C-1: 8 m, C-2: 24 m, C-3: 40 m, C-4: 56 m, C-5: 120 m, C-6: 152 m, C-7: 200 m, and C-8: 248 m).
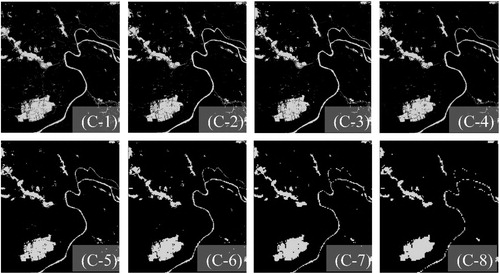
Table 2. Descriptions and broad definitions of selected 18 landscape pattern indices.
Table 3. Influence of different spatial resolution on the regional accuracy of water extraction.
Figure 5. The change of average regional accuracy with different spatial resolutions and spatial extents.
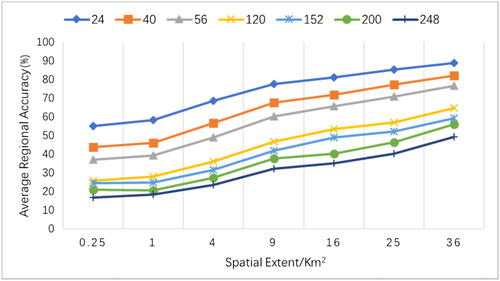
Figure 6. Average regional accuracy changes with different proportion of water body. (a) The average regional accuracy of 1 km2. (b) the average regional accuracy of 4 km2.
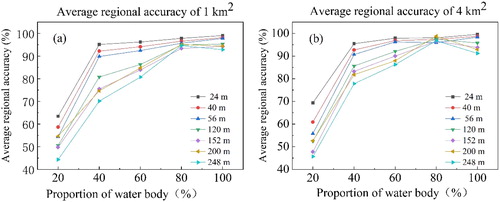
Table 4. Correlation between RE and landscape pattern indices with different resolution.
Figure 7. The relationship among water extraction error and proportion of water body and PARA.
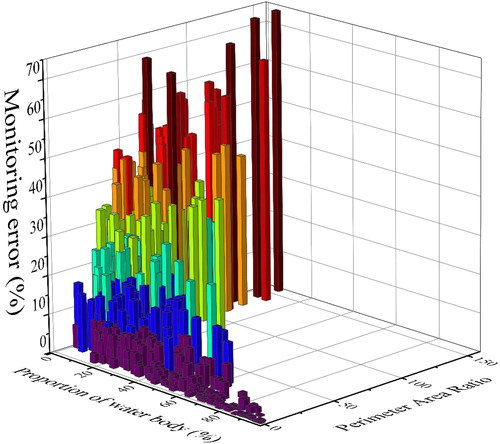
Figure 8. The relationship among water extraction error and proportion of water body and PLADJ.
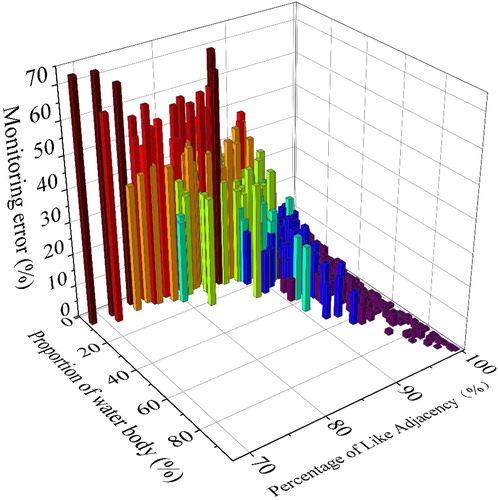
Figure 9. The relationship among water extraction error and proportion of water body and COHESION.
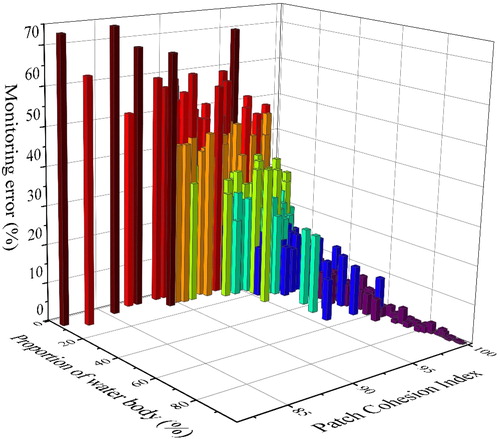
Table 5. Results of water body area with different patch shape complexity.
Table 6. A multivariate regression equation parameters.
Table 7. Regional accuracy of water extraction with the proportion of water body, the landscape pattern indices, and different spatial resolution images.