Figures & data
Figure 1. Tornado counts in the contiguous United States for storms occurring between 1950 and 2015. Counts have been aggregated per county and symbolized showing standard deviation from the mean. Source: Author
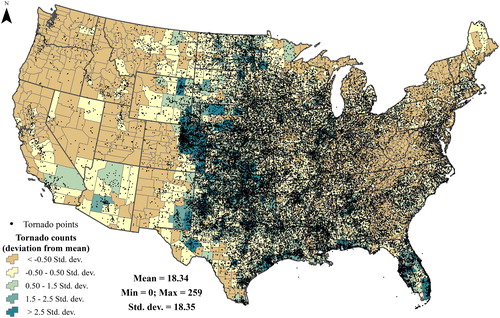
Figure 2. Getis-Ord hotspot results and z-scores for tornado occurrences at the county level. Tornado Alley and Dixie Alley are delineated based on 95% confidence bounds. Source: Author.
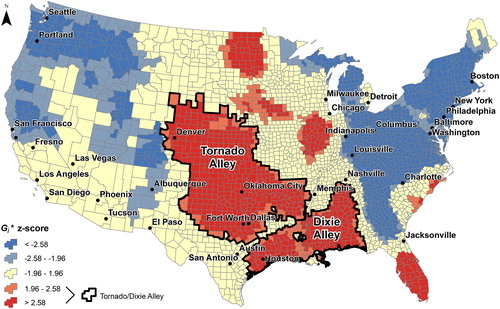
Table 1. Observation totals for severe storms in Tornado Alley and Dixie Alley (2001–2015).
Figure 3. Land surface heterogeneity variables for Tornado Alley and Dixie Alley: (a) elevation, (b) slope, (c) aspect, (d) distance to major rivers, and (e) land cover (Devel. = Developed). Source: Author
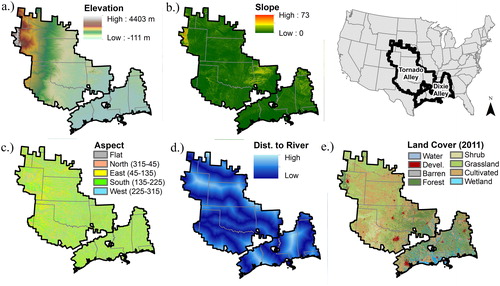
Table 2. Logistic regression results for weakly tornadic supercells (EF0-EF1) in Tornado Alley versus Dixie Alley.
Table 3. Logistic regression results for significantly tornadic supercells (EF2-EF5).
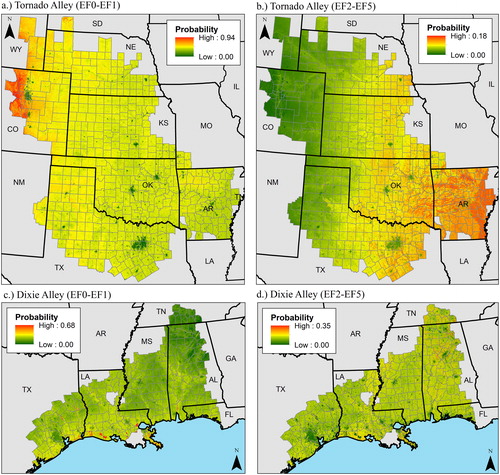
Figure 4. Tornado probability surfaces based on logistic regression coefficients. Please note scales are different between maps to allow visualization of variation. Source: Author