Figures & data
Table 1. Physical and mechanical properties of Laizhou granite samples.
Figure 1. SEM photos of the Laizhou granite sample; (a) staircase-formed feldspar crystals and (b) micro-cavities and cracks exist in the contact zone between the quartz and feldspar.
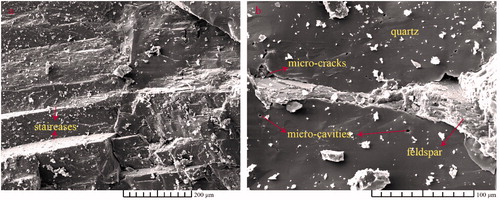
Table 2. Experiment scheme and failure information.
Figure 2. Stress path of strain burst.
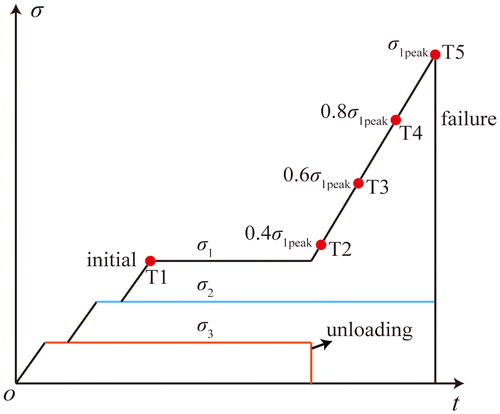
Figure 3. Schematic of strain burst machine.
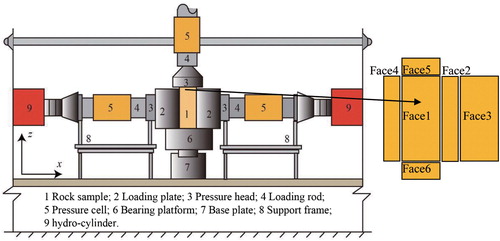
Figure 4. Arrangement of AE sensors (unit: mm).
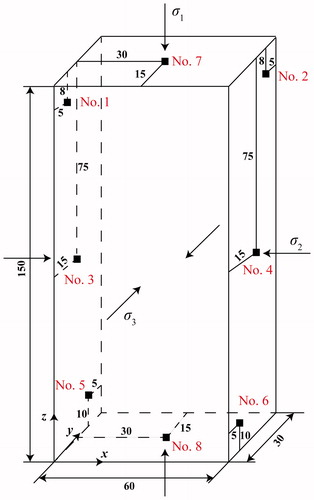
Figure 5. Pencil-lead breakage test and results (unit: mm), (a) pencil-lead break position and (b) location results.
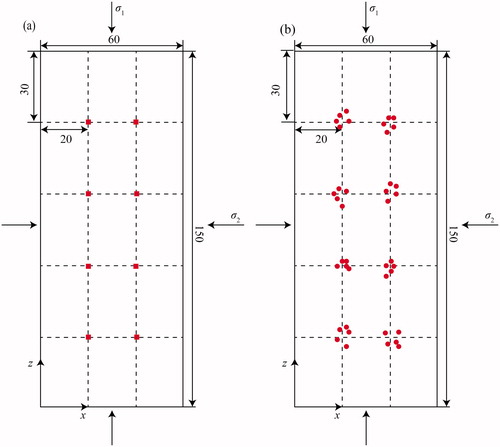
Figure 6. Schematic of the P-wave onset time and amplitude of the first motion determination.
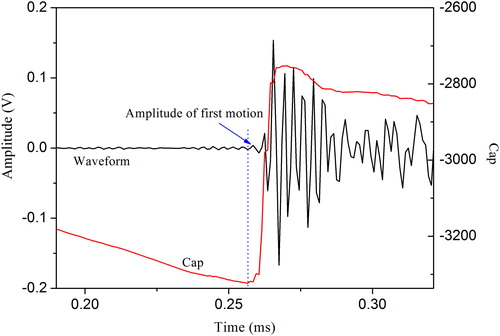
Figure 7. Failure process and photos of granite strain burst for specimen (a) G1, (b) G2, and (c) G3, respectively, the number in the bottom left corner of the photos is the physical time of the corresponding phenomena.
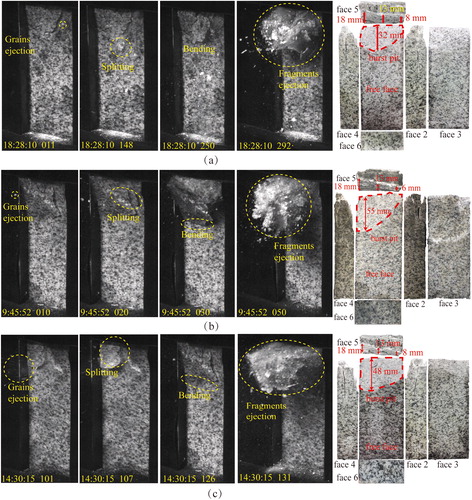
Figure 8. (a–e) Event density contours for T1–T5, respectively, and (f) failure photos of specimen G1. Note: events of each point were non-accumulated, for example, events of point T2 were events occurred from T1 to T2.
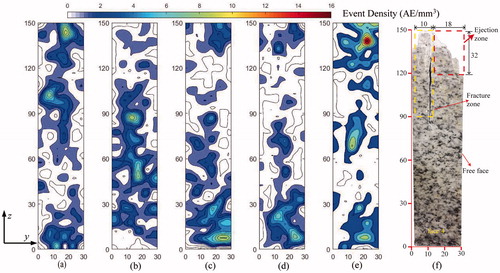
Figure 9. (a) Maximum event density, (b) percentage of events number to total events and (c) three principal stress versus time for specimen G1.
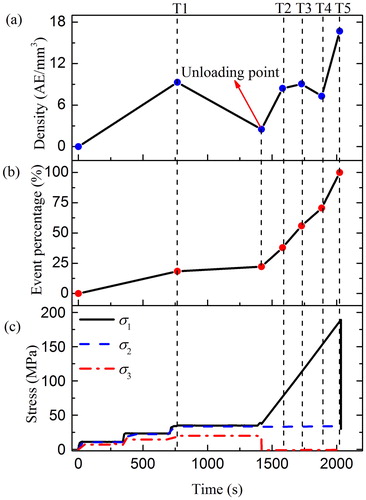
Table 3. Variation of maximum event density and accumulated event percentage for granite strain burst.
Figure 10. Spatial distribution of three types of micro-cracks for specimen G1, (a–e) for T1–T5, respectively.
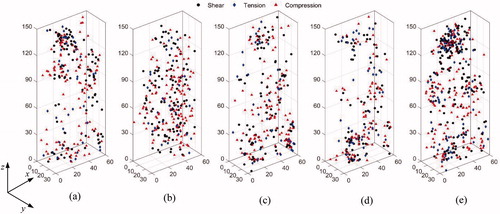
Table 4. Number and ratio of the three types of micro-cracks.
Figure 11. (a) evolution of accumulated energy for three types of micro-cracks with time elapses and (b) stress paths for specimen G1.
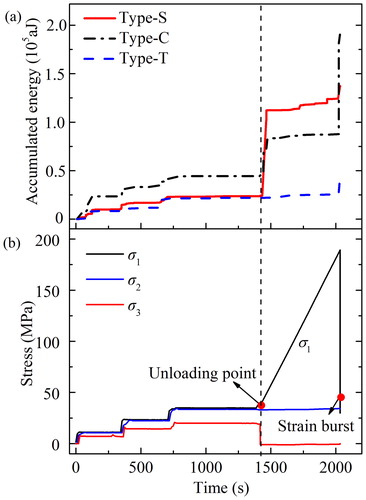
Table 5. Energy increment of three types of micro-cracks at unloading and strain burst moments.
Figure 12. The mean accumulated (a) percentage of the three types of micro-cracks and (b) released AE energy of five key points (T1–T5) for three samples.
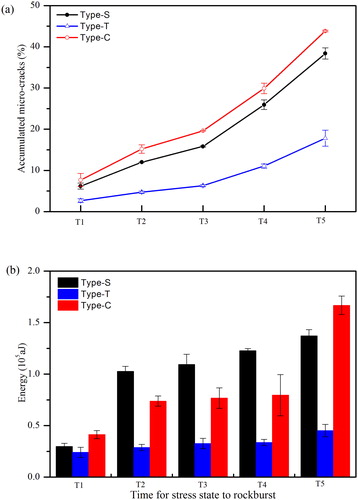
Figure 13. Evolution of mean b-values of micro-cracks in different key points for three samples, (a) for total micro-cracks (b) compression, (c) shear and (d) tensile micro-cracks.
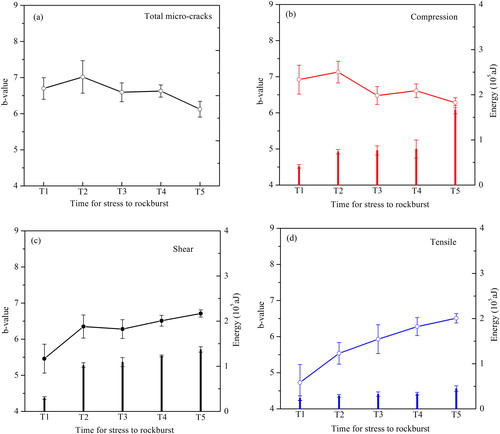
Figure 14. Evolution of mean b-values of micro-cracks in different zones.
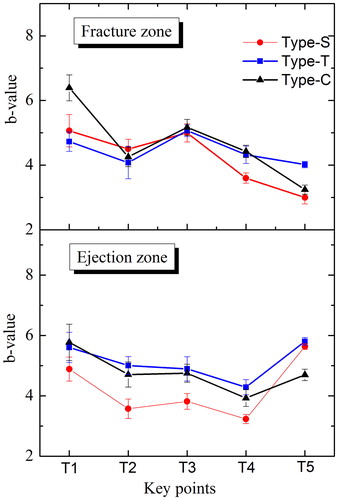
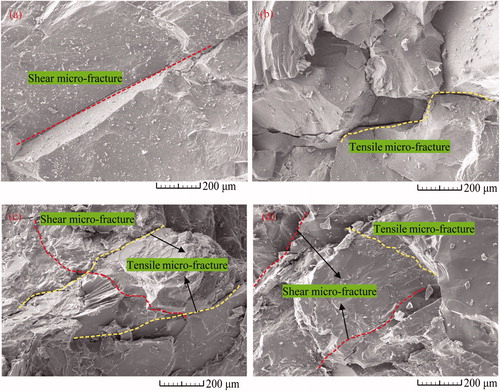
Figure 15. SEM photos of the fragments which taken from (a–b) fracture zone to (c–d) ejection zone.