Figures & data
Figure 1. Location of the study area and spatial distribution of landslide inventories.
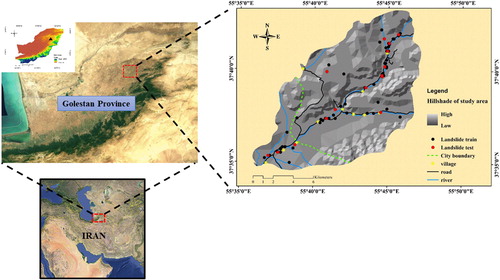
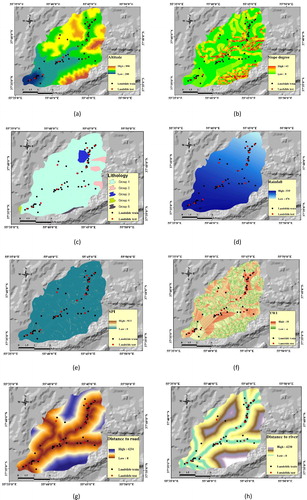
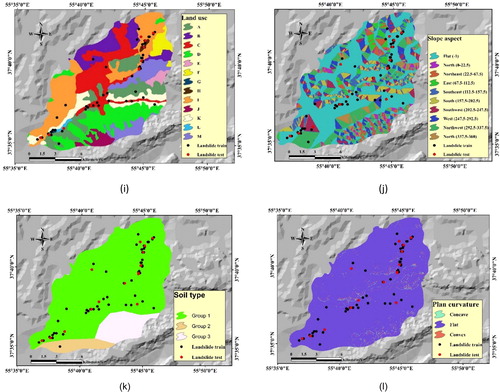
Figure 3. Description and distribution of the nominal parameters: (a) lithology, (b) land use, (c) slope aspect and (d) soil type.
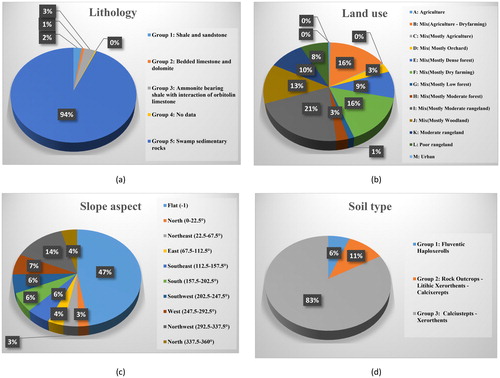
Figure 4. The graphical methodology of applied procedure for landslide hazard zonation.
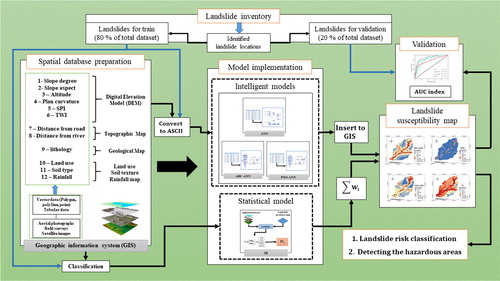
Figure 5. The general structure of MLP.
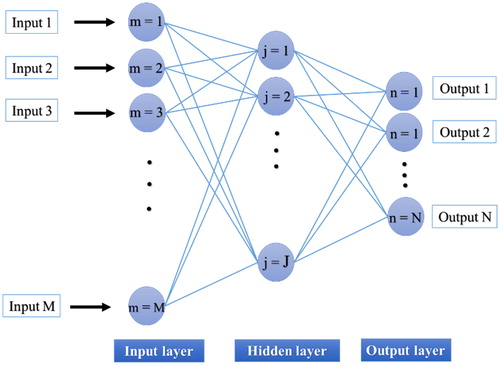
Figure 6. General mechanism of (a) ABC algorithm and (b) ABC-ANN method.
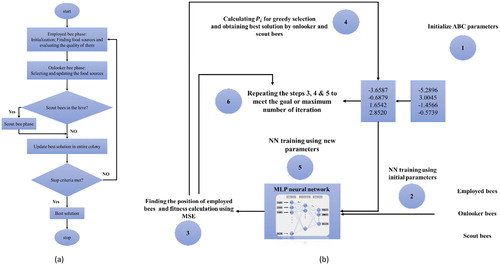
Figure 7. General mechanism of (a) PSO algorithm and (b) PSO-ANN method.
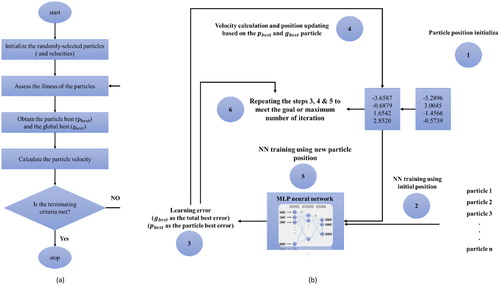
Table 1. The spatial relationship between the landslide and its causative factors.
Figure 8. Sensitivity analysis for ANN based on the number of hidden neurons.
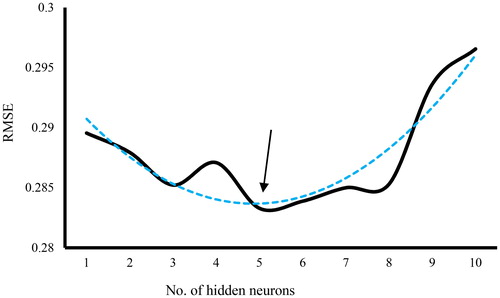
Table 2. Weight and biases of the ANN model.
Figure 9. Sensitivity analysis for ABC-ANN based on colony size.

Table 3. Optimized weight and biases of the ABC-ANN model.
Table 4. Optimized weight and biases of the PSO-ANN model.
Figure 10. Sensitivity analysis for PSO-ANN based on swarm size.
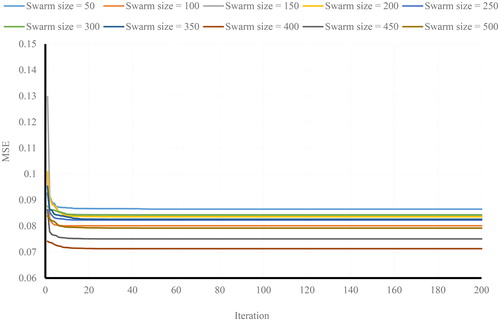
Figure 11. A view of landslide hazard maps developed in GIS model (a) SI, (b) ANN, (c) ABC-ANN and (b) PSO-ANN estimation of LSVs.
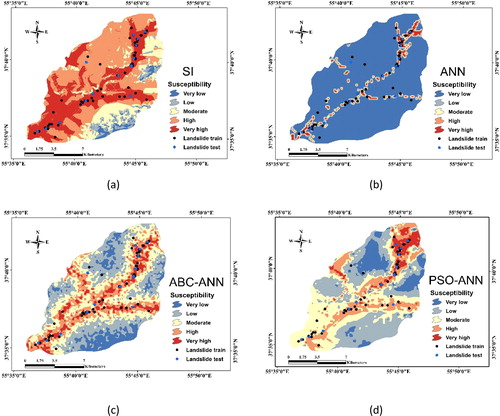
Figure 12. Column chart based on the percentage of landslide hazard classes.
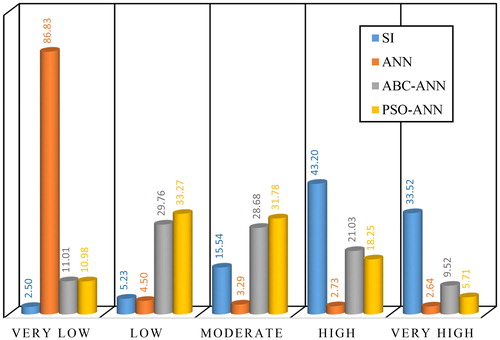
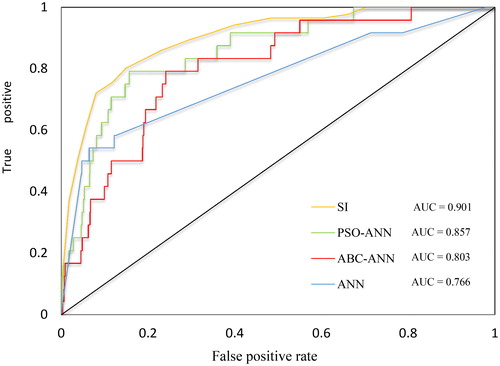
Figure 13. The ROC diagram, obtained for SI, ANN, ABC-ANN, and PSO-ANN models.