Figures & data
Figure 1. Location map of the study area. Source: Institute of Henan Geological Survey (http://www.hnddy.com/)
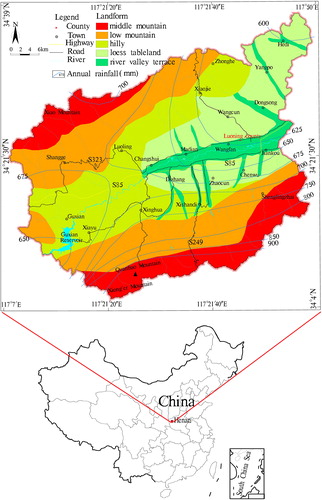
Table 1. Basic features of landform of the study area.
Figure 2. Classification of geotechnical engineering rocks group and fault distribution. Source: Institute of Henan Geological Survey (http://www.hnddy.com/)
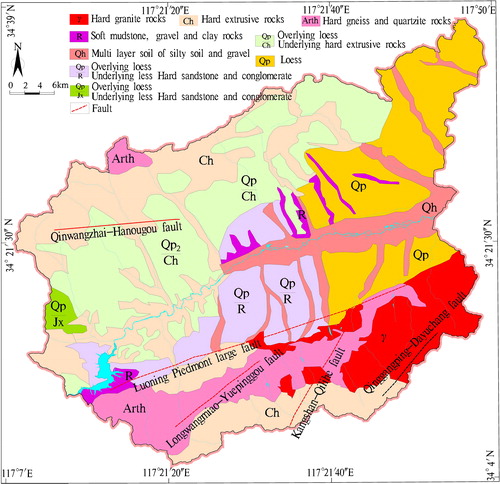
Figure 3. Types of land use in the study area. Source: Institute of Henan Geological Survey (http://www.hnddy.com/)
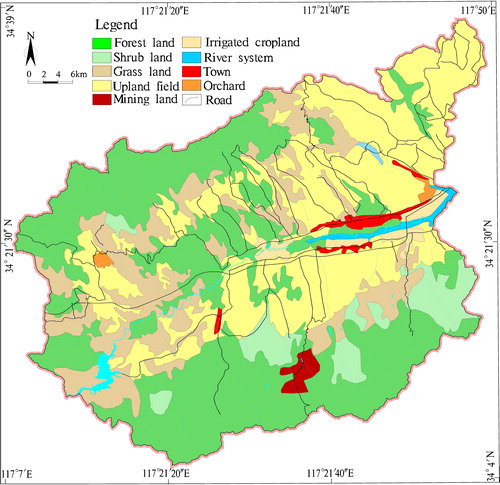
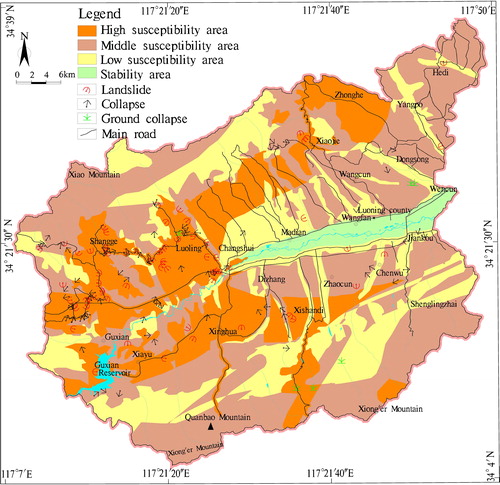
Figure 4. Distribution map of geological environmental hazards in the study area. Source: Institute of Henan Geological Survey (http://www.hnddy.com/), Ministry of Land and Resources of PRC (http://www.mnr.gov.cn/)
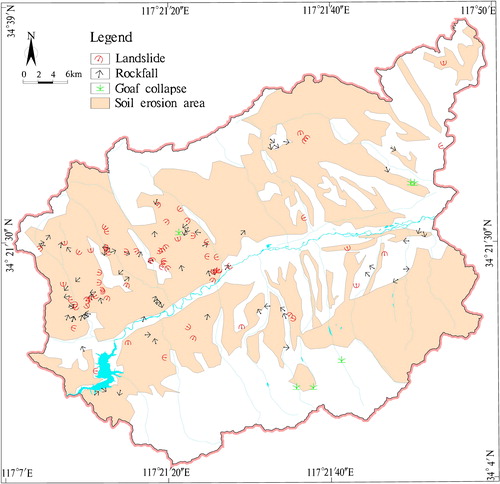
Table 2. Land use types and their geological environmental effects in study area.
Figure 5. Flow chart of this study. Source: Authors
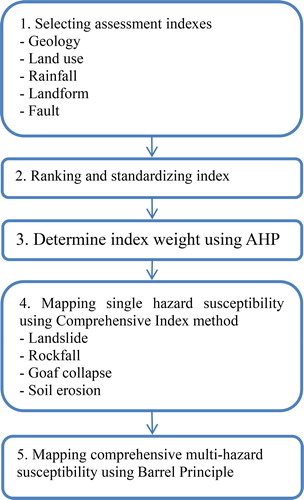
Table 3. The 1–9 scales for pairwise comparisons in the AHP.
Table 4. Random Consistency Index (RI) (Saaty, Citation1980, Citation2000).
Table 5. Assessment index system of four hazards susceptibility.
Table 6. Pairwise comparison matrix for landslide susceptibility assessment. L1 = Landform, L2 = Engineering geology, L3 = Distance from fault, L4 = Land use, L5 = Rainfall.
Table 7. Pairwise comparison matrix for rockfall susceptibility assessment. R1 = Landform, R2 = Engineering geology, R3 = Distance from fault, R4 = Land use, R5 = Rainfall.
Table 8. Pairwise comparison matrix for goaf collapse susceptibility assessment. G1= Soil type, G2 = Distance from fault, G3 = Rainfall, G4 = Land use.
Table 9. Pairwise comparison matrix for soil erosion susceptibility assessment. S1 = Soil type, S2 = Landform, S3 = Rainfall, S4 = Land use type.
Figure 6. Single-hazard susceptibility zoning map. (a) Landslide, (b) Rockfall, (c) Goaf collapse, (d) soil erosion. Source: Authors
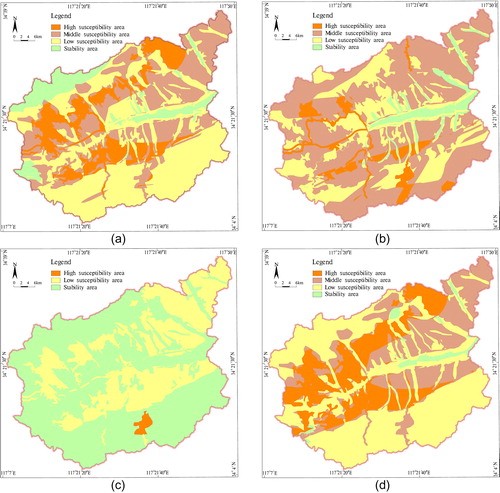
Table 10. Statistical table of single hazard susceptibility assessment mapping.
Figure 7. Comprehensive multi-hazards susceptibility map. Source: Authors
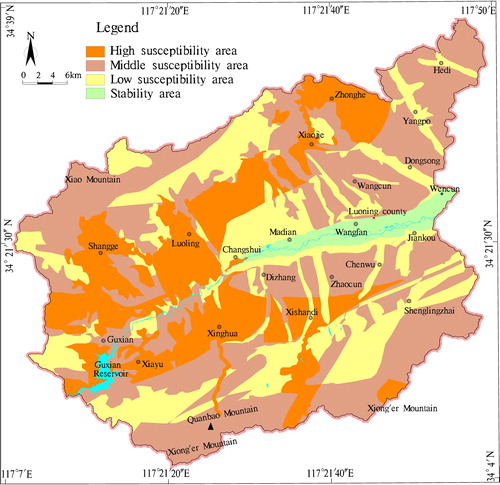
Figure 8. The success-rate results of the single hazard susceptibility maps obtained from the AHP. Source: Authors
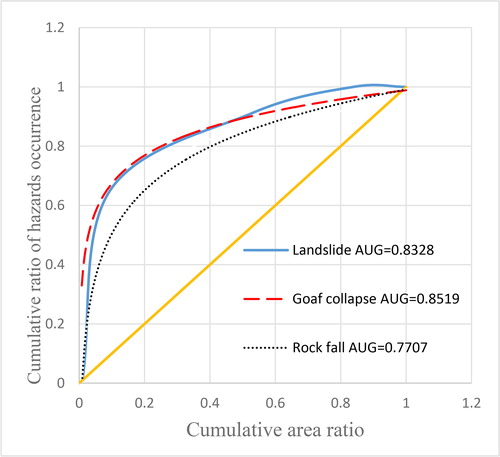
Figure 9. Compared the main roads with the comprehensive susceptibility map. Source: Authors