Figures & data
Figure 1. Drainage system in Służewiecki Stream Catchment in Warsaw (source: Barszcz Citation2018 and re-drawn by author). Calculation cross-sections and precipitation stations: 1 – Rosoła, 2 – Kłobucka, 3 – Okęcie, 4 – Ursynów.
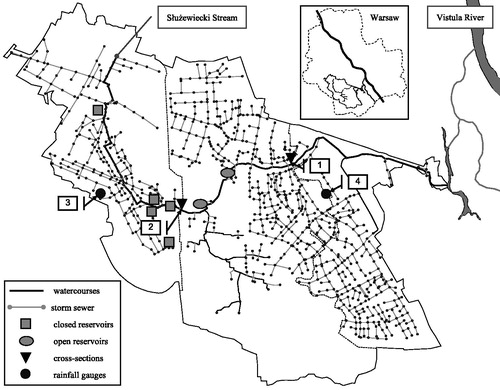
Figure 2. Objects of the catchment sewer system (subcatchments, channels) and rain gauges (existing: Okęcie and Ursynów, virtual – 66 objects) in the SWMM model (source: Barszcz (Citation2018) and re-drawn by author).
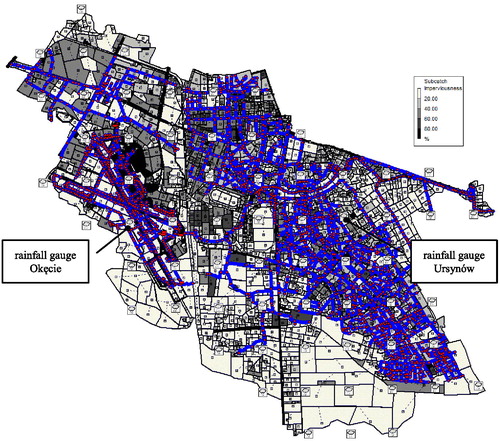
Figure 3. SRI product and field indicating the range of data analysis covering the analysed catchment. Source: The Institute of Meteorology and Water Management - National Research Institute
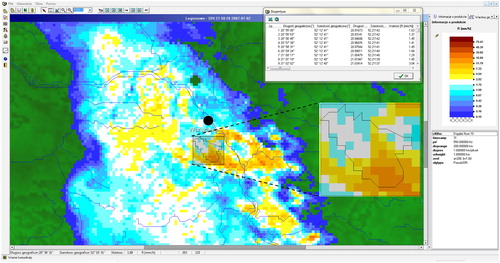
Table 1. Rainfall totals using data from rainfall gauges and weather radar.
Figure 4. Relationship determined on the basis of data for Ursynów precipitation station. Source: Author
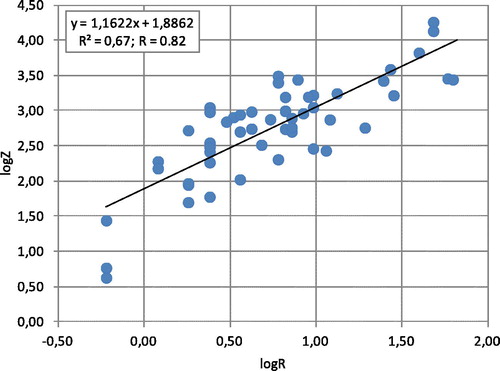
Table 2. Flows in calculation cross-sections using data for two rainfall gauges (Scenarios 1 and 2).
Table 3. Flows in calculation cross-sections using data for 66 rainfall gauges (Scenarios 3–4).
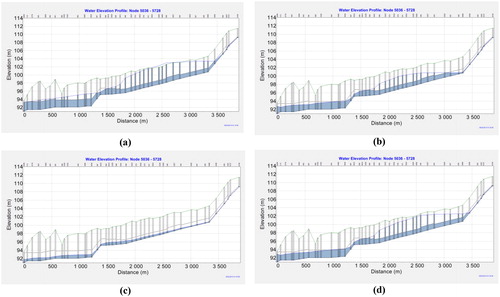
Figure 5. Profiles of maximum water level in one of the main collectors obtained for various scenarios in response to the rainfall event occurring on 15 August 2008: (a) Scenario 1; (b) Scenario 2; (c) Scenario 3; (d) Scenario 4. Source: Author