
Figures & data
Figure 1. Watershed with locations of rainfall stations and gauge sites. Source: Author
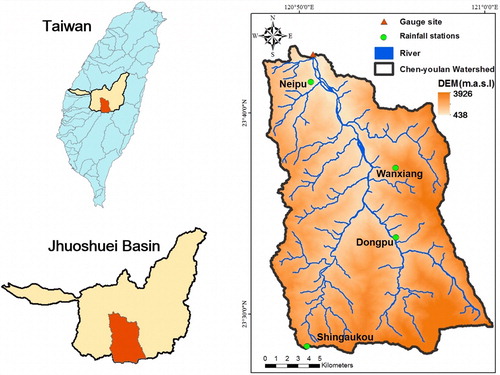
Table 1. Study materials.
Figure 2. Using statistical methods to sort land use on the basis of satellite images. Source: Author
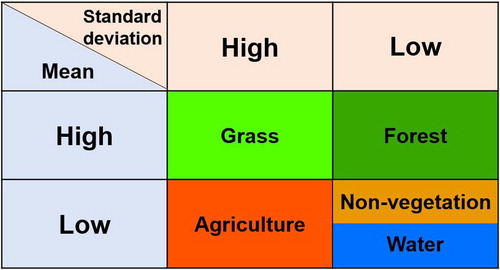
Table 2. Results of accuracy assessment.
Figure 3. Rainfall and runoff for HAITANG typhoon event. Source: Author
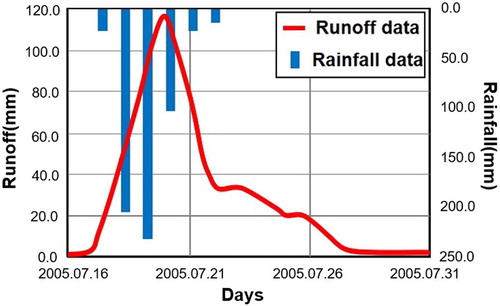
Figure 4. Comparison of land cover types obtained using satellite-image-based classification with aerial photographs. Source: Author
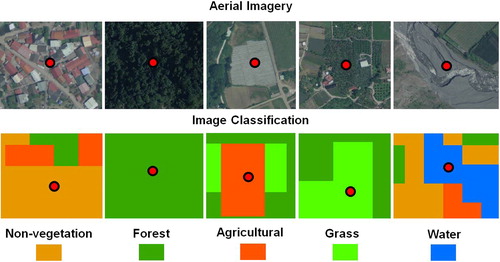
Figure 5. Spatial distributions of land cover types, hydrologic soil group, and CN values of the Chenyoulan watershed in 2008. Source: Author
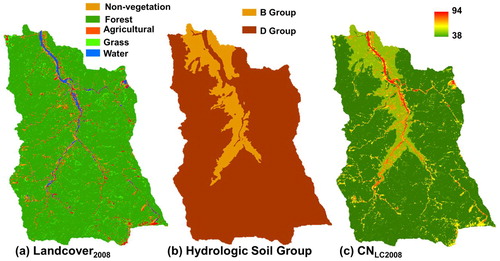
Table 3. Typhoon events and related data.
Figure 6. Relationship between observed and estimated runoff depths. Source: Author
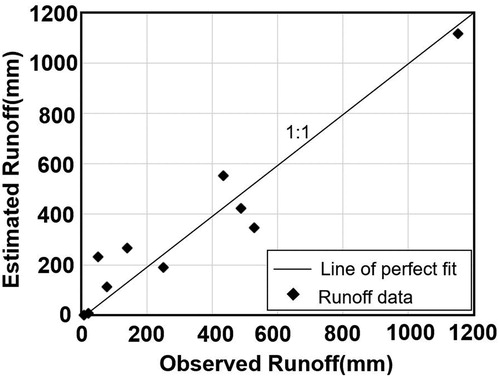
Figure 7. Percent deviation between observed and estimated runoff values. Souce: Author
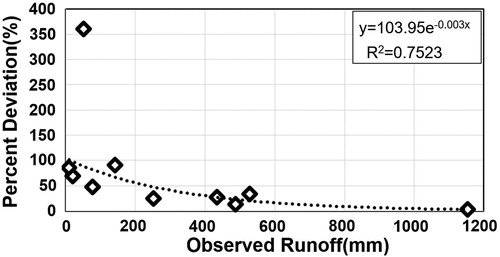
Figure 8. Relationship between grid-based estimated values and observed values. Source: Author
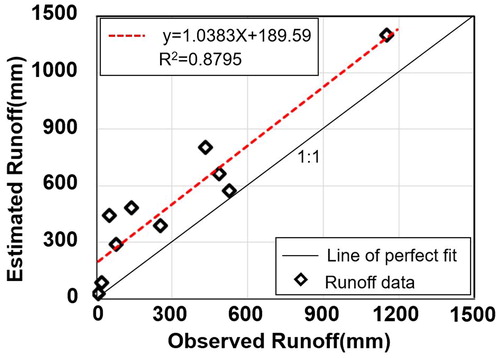
Figure 9. Spatial distribution of flooding risks during Typhoon Morakot. (a) Spatial distribution of the potential maximum retention in 2008 (b) Spatial distribution of the runoff during Typhoon Morakot (c) Spatial distribution of the runoff after model revision (d) Spatial distribution of the topographic wetness indices (e) Spatial distribution of Typhoon Morakot-induced flood risks (f) Spatial distribution of the disaster locations. Source: Author
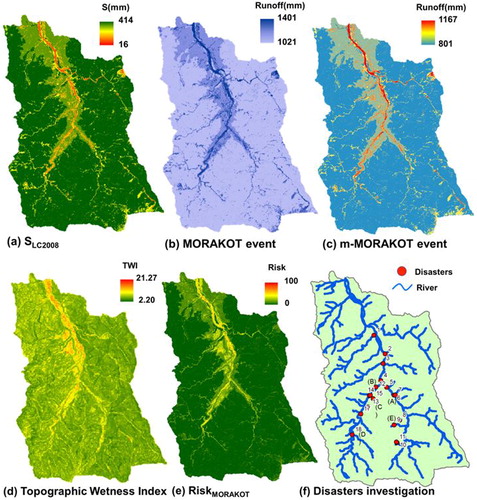
Figure 10. Flooding risk grades of disaster sites during Typhoon Morakot. Source: Author
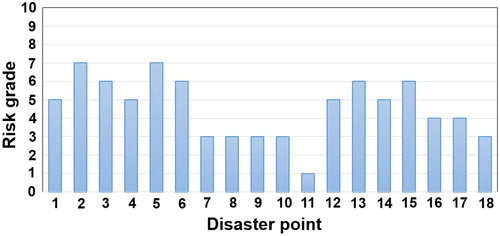
Figure 11. Relationship between flooding risk grades and number of corresponding disaster sites during Typhoon Morakot. Source: Author
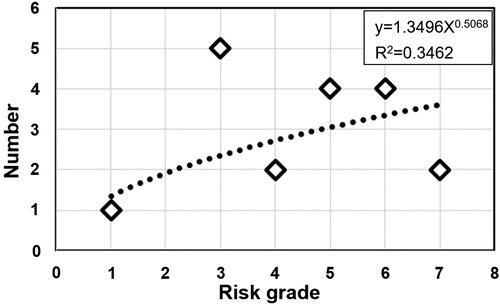
Figure 12. Hotspots based on analysis of Typhoon Morakot. Source: Author
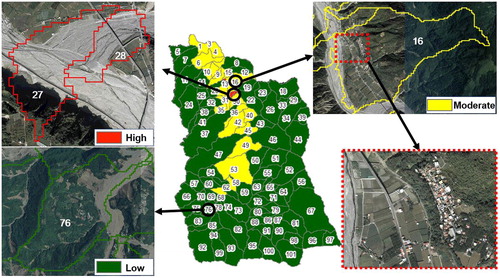
Figure 13. Scouring caused by Typhoon Morakot (Source: Yang et al. Citation2009).
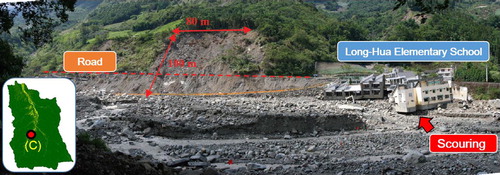
Figure 14. Scouring of riverbanks. Source: Author
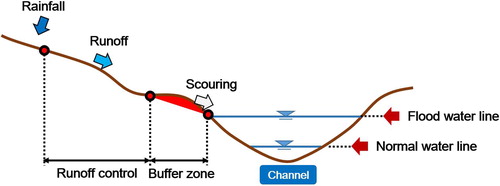
Table 4. Notable disaster sites in the Chenyoulan watershed.
Data availability statement
Not applicable.