Figures & data
Figure 1. The study area and its location in China. Source: http://nfgis.nsdi.gov.cn, http://nfgis.nsdi.gov.cn/nfgis/chinese/cxz.htm.
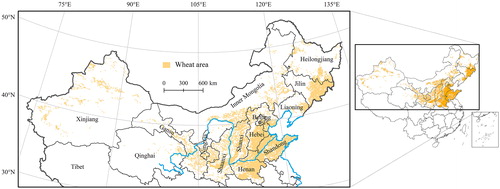
Table 1. The studied phase of the wheat heatwave hazard in each wheat-planting region in northern China.
Table 2. Heatwave hazard indicators.
Figure 2. Spatial Distribution of the HF in northern China (a. 2011–2040; b. 2041–2070; c. 2071–2099).
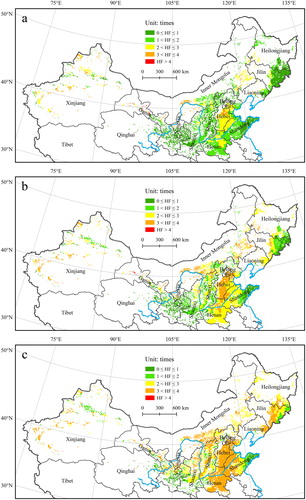
Figure 3. Spatial distribution of HD in northern China (a. 2011–2040; b. 2041–2070; c. 2071–2099).
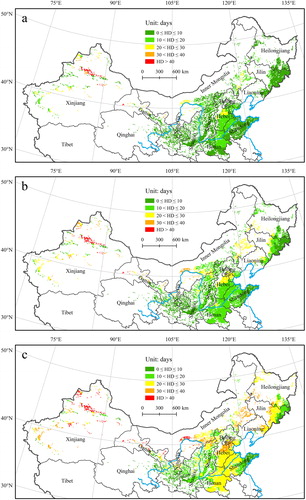
Figure 4. Spatial distribution of HI in northern China (a. 2011–2040; b. 2041–2070; c. 2071–2099).
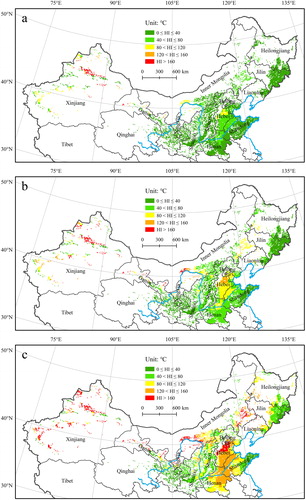
Figure 5. Temporal variations in heatwave impacts on wheat in northern China.
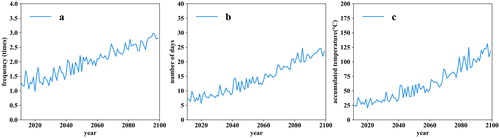
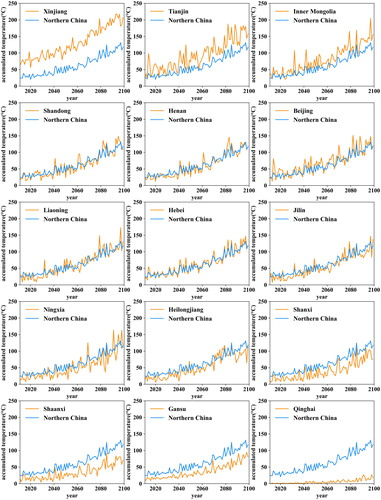
Figure 6. Provincial temporal variation in HF in northern China.
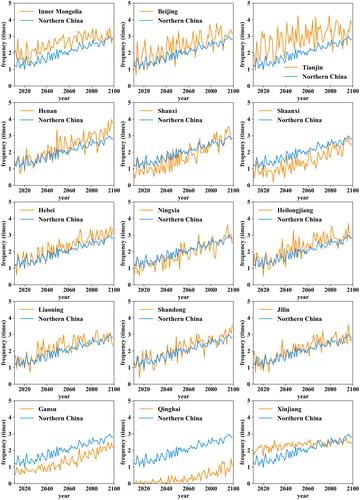
Figure 7. Provincial temporal variation in HD in northern China.
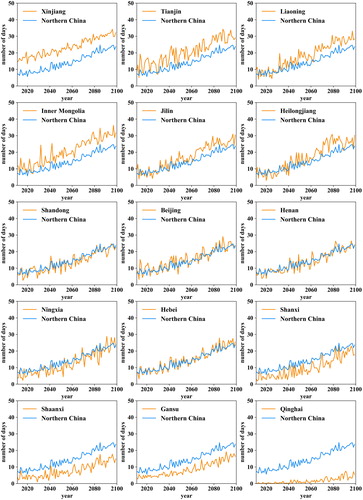
Figure 8. Provincial temporal variation in HI in northern China.