
Figures & data
Figure 1. Geological map of the study area, the MASW test sites (numbered red dots) and locations of the boreholes (numbered blue dots) used in the study.
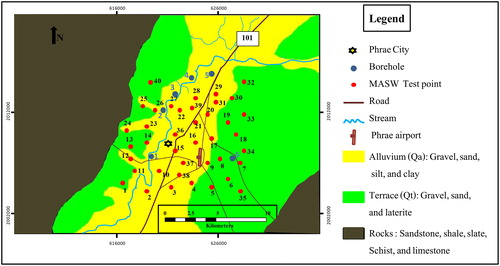
Figure 2. Active faults in Northern Thailand (Thitimakorn Citation2013).
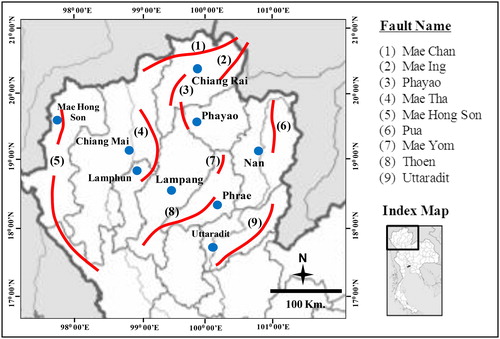
Table 1. The NEHRP soil profile type classification for seismic amplification (BSSC Citation2003).
Figure 3. Schematic diagram showing the MASW data acquisition field setup.
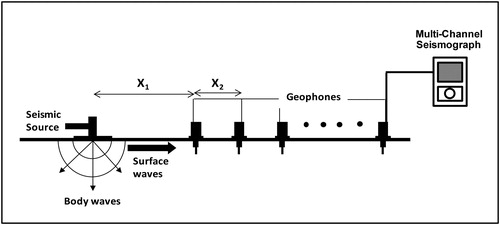
Figure 4. Processing steps for MASW data showing the (a) MASW shot gather, (b) corresponding overtone image with picked fundamental-mode of dispersion curve, and (c) Vs profile.
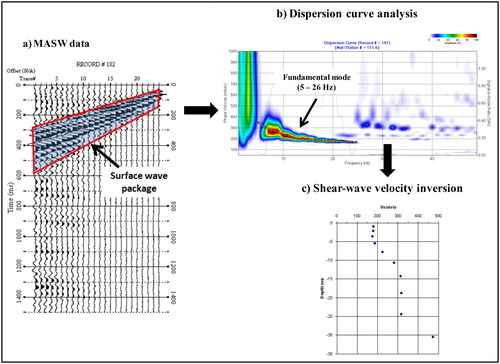
Figure 5. Variation of Vs with depth in (a) alluvium (Qa) and (b) terrace (Qt) soil units.
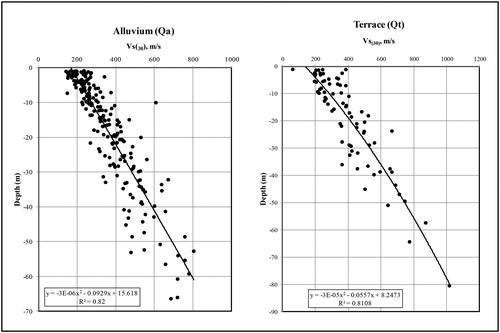
Figure 6. Representative soil profile in the study area from the six boreholes.
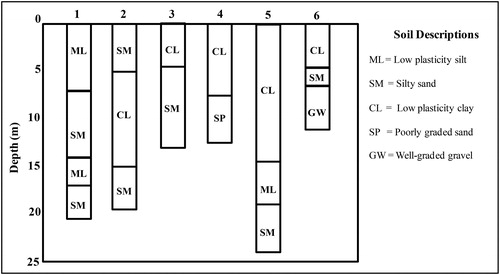
Figure 7. Plot of Vs(30) in the (a) alluvium (Qa) and (b) terrace (Qt) soil units at different MASW stations.
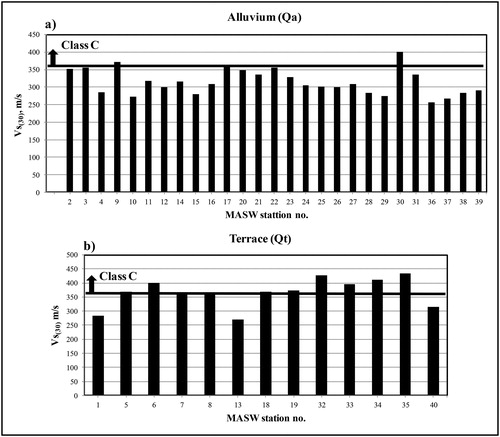
Figure 8. Map showing the Vs(30) around Phrae City and its location within Thailand.
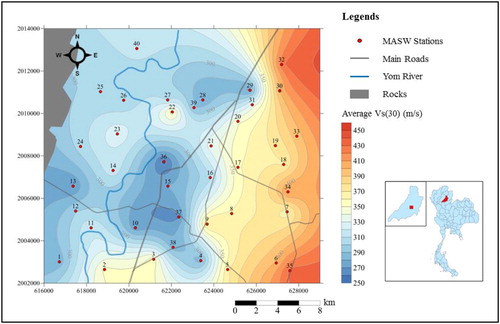
Table 2. NEHRP site classification for each soil unit.
Figure 9. Map of NEHRP site classifications for Phrae City.
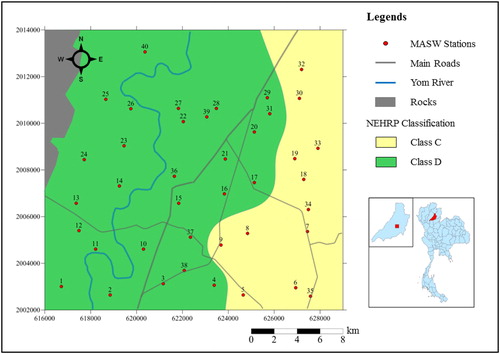
Figure 10. Preliminary soil amplification map of Phrae city.
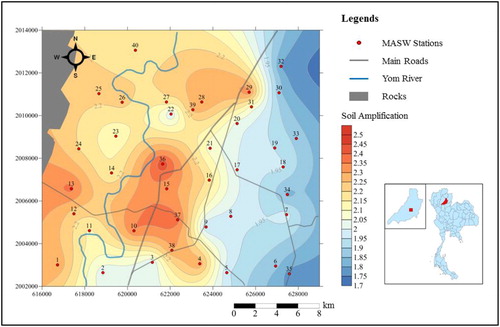
Figure 11. Natural site period map of Phrae City.
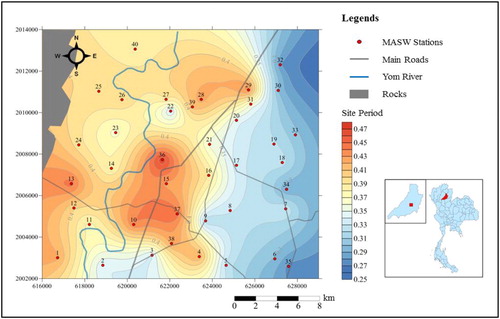
Table 3. Natural period of buildings with different stories.