Figures & data
Figure 1. The geographic location of the region of Tunis. Source: Author
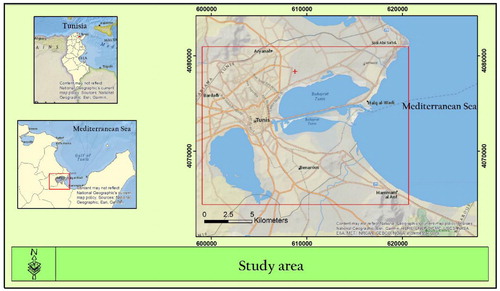
Figure 2. Assembly of the geological maps (1:50.000) of Ariana, Marsa, Tunis and La Goulette (Source: modified from ONM, Ferchichi et al. 2017).
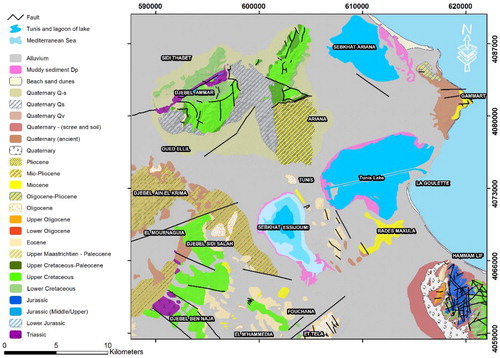
Figure 3. Study area (Mornag plain). Source: Author.
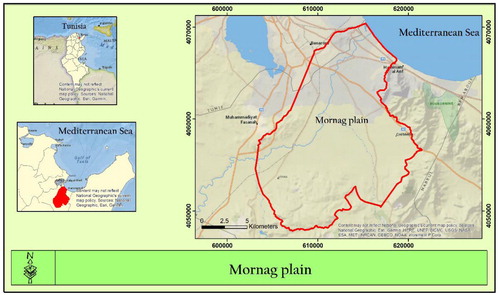
Figure 4. Geological map (1:50.000) showing the main outcrops of the Oligo-Quaternary in Mornag plain (Source: La Goulette and Tunis).
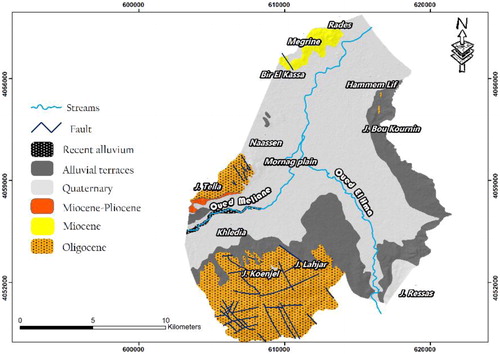
Figure 5. Variation of thicknesses of the Quaternary sediments (compressible layers) in Mornag plain (Farhat 2011). Source: Author
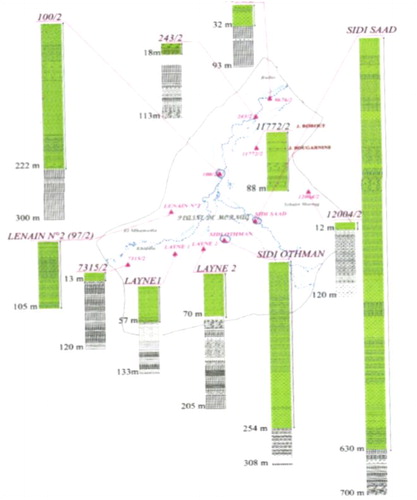
Table 1. Characteristics of Envisat ASAR and Sentinel 1B SAR data used for the analysed periods (2003–2007) and (2016–2018).
Figure 6. SBAS workflow. Source: Author.
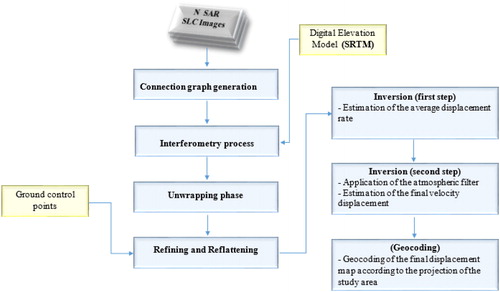
Figure 7. Connection graph showing perpendicular and temporal baselines of SLC pairs relative to the master image: (A) Envisat ASAR (master: 24 May 2005); (B) Sentinel 1B (master: 24 December 2017). Source: Author.
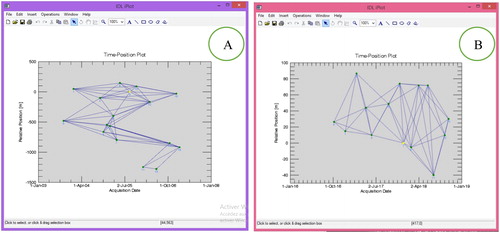
Figure 8. Spatial distribution of surface deformations (LOS) in Tunis City (mm/year) obtained from Envisat SBAS analysis (2003–2007). Source: Author.
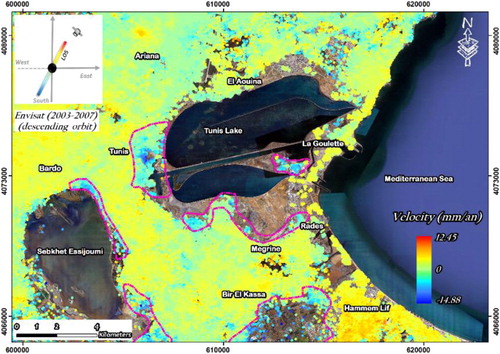
Figure 9. Spatial distribution of surface deformations (LOS) in Tunis City (mm/year) obtained from Sentinel 1B SBAS analysis (2016–2018). Source: Author.
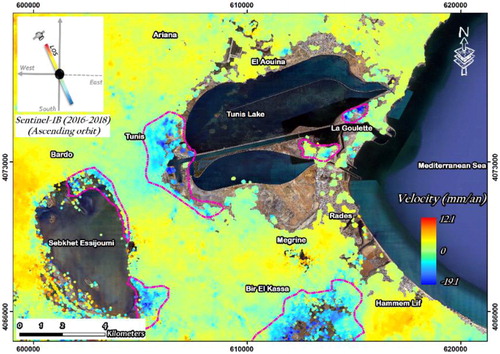
Figure 10. Geotechnical map of Tunis City (Source: Guilloux and Nakkouri 1976), modified.
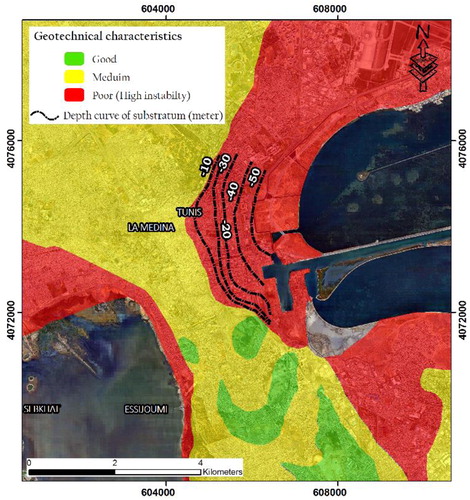
Figure 11. Spatial distribution of thicknesses of the muddy soil in the region of Tunis (Source: Kaaniche 1989), modified.
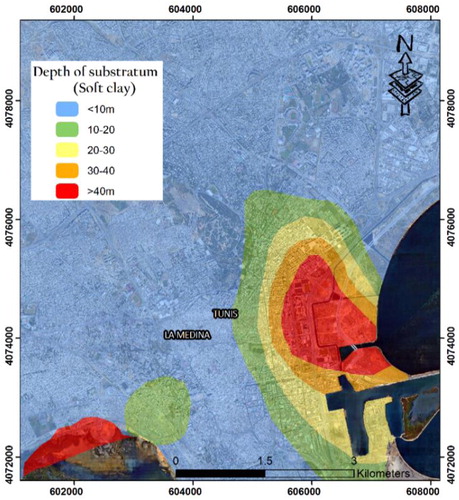
Figure 12. Lithological column (reconstituted from core holes) located in instable area of Tunis City (Source: Klai and Bouassida 2016, modified).
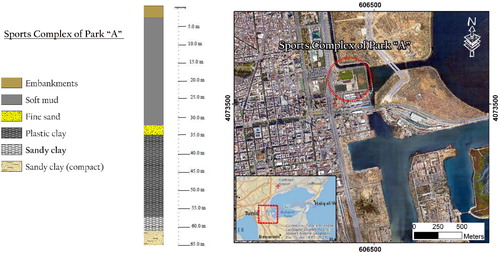
Figure 13. Example of structural damage identified in downtown Tunis (Klai and Bouassida 2016).
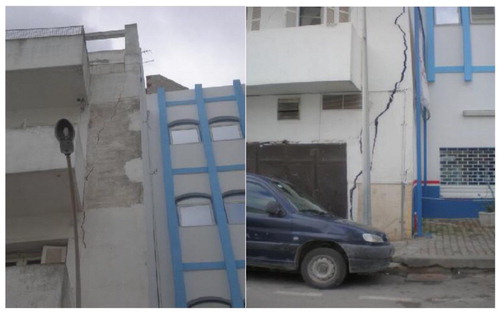
Figure 14. Photo example of a building (currently abandoned) was built in the late 80s, located in front of the old port of Tunis, showing the inclination of this building a few degrees to the East, (Saad Zaghloul Street). Source: Author.
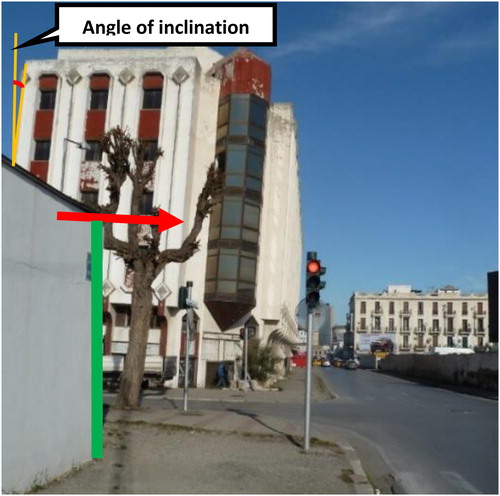
Figure 15. Photo example of an old building, located in Avenue Hedi Nouira, showing the inclination of this building a few degrees to the East. Source: Author.
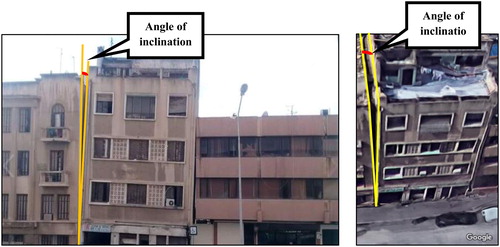
Figure 16. Spatial distribution of surface deformations (LOS) in Mornag plain (mm/year) obtained from Envisat SBAS analysis (2003–2007). Source: Author.
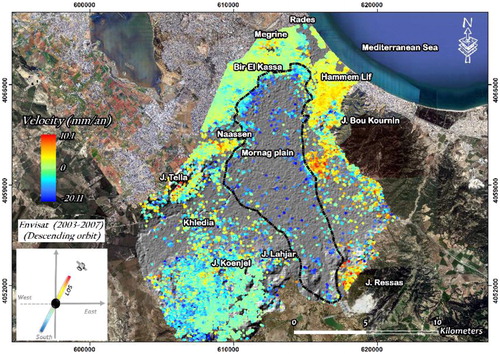
Figure 17. Spatial distribution of surface deformations (LOS) in Mornag plain (mm/year) obtained from Sentinel 1B SBAS analysis (2016–2018). Source: Author.
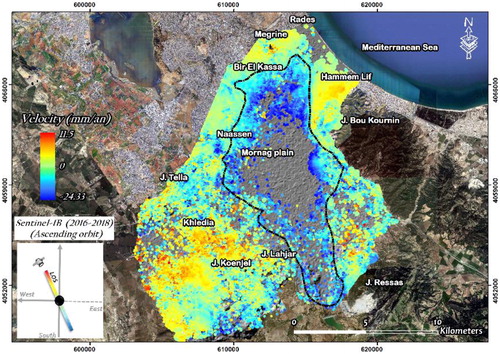
Figure 18. Irrigated agricultural land in Mornag region. Source: Author.
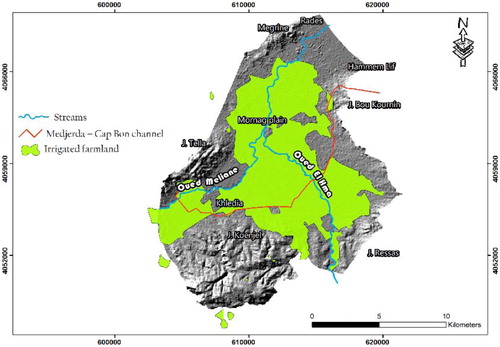
Figure 19. Piezometric level of three wells in Mornag aquifer during the period (1965–2000) (Source: Charef et al. 2012).
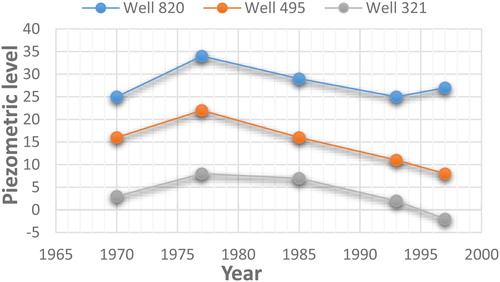
Figure 20. The distribution of some groundwater monitoring wells for both periods (2003–2007) and (2016–2018). Source: Author.
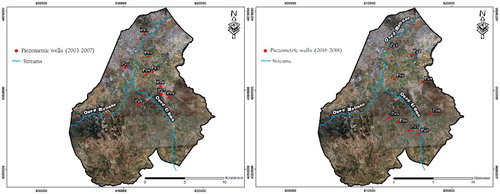
Figure 21. Evolution of piezometric level at selected wells in Mornag plain (2004–2008). Source: Author.
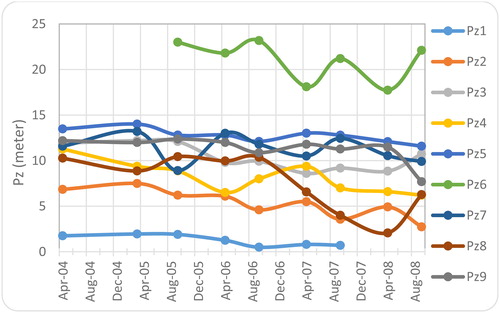
Figure 22. Evolution of piezometric level at selected wells in Mornag plain (2009–2018). Source: Author.
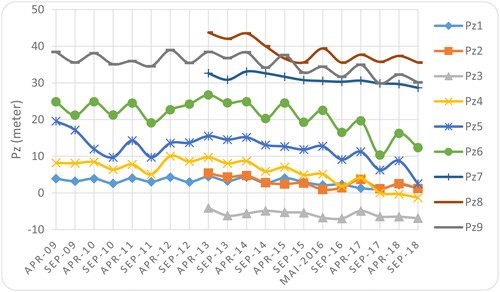
Figure 23. The relationship between deformation time series (LOS) for Envisat SAR data and piezometric levels during (2003–2007) at selected well points (Pz1, Pz2, Pz3, Pz5). Source: Author.
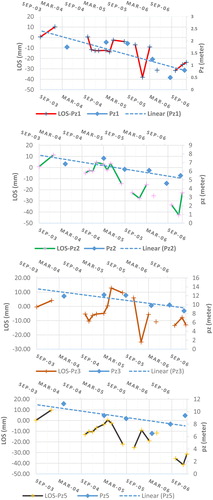
Figure 24. The relationship between deformation time series (LOS) for Sentinel 1B SAR data and piezometric levels during (2016–2018) at selected well points (Pz4, Pz5, Pz6, Pz9). Source: Author.
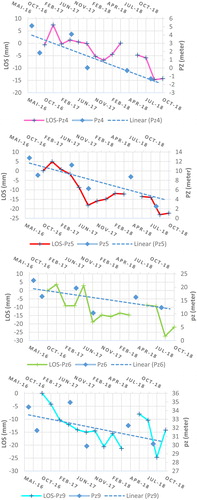
Figure 25. Cross-section profile of Mornag plain showing the geometry of the compressible layers and the structure of this area (‘Source: Gestion des ressources en eau en Tunisie: bilan et perspectives d’avenir’), modified.
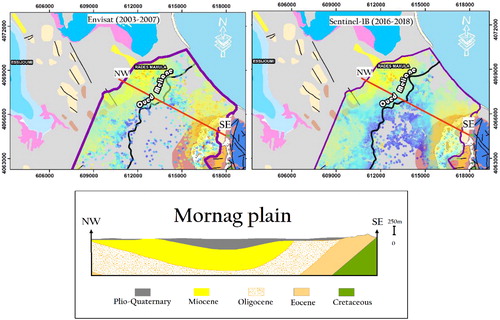
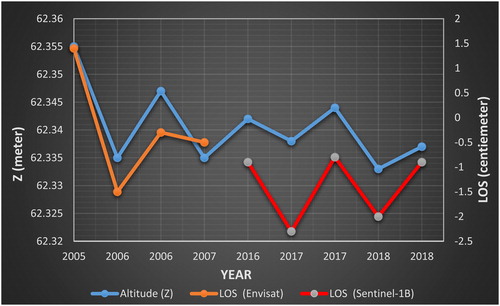
Figure 26. Topographic variations recorded by the permanent station associated to the SBAS time series of surface deformations (LOS) during the period (2003–2018). Source: Author.