
Figures & data
Figure 1. VIIRS Value Distribution for VIIRS values below 2. Source: Authors’ estimates based on VIIRS and population layer data (see text for details).
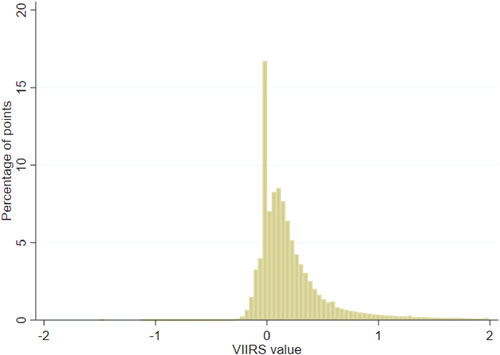
Figure 2. Days with No Cloud Cover in a Month. Source: Authors’ estimates based on VIIRS and population layer data (see text for details).
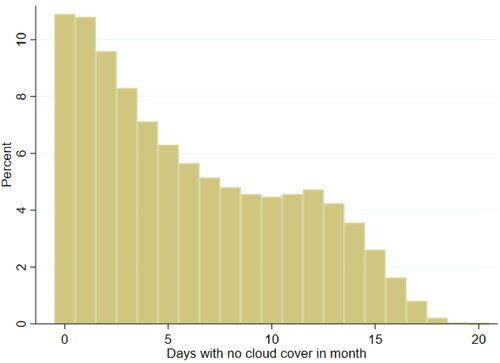
Figure 3. Flow chart for methodology.
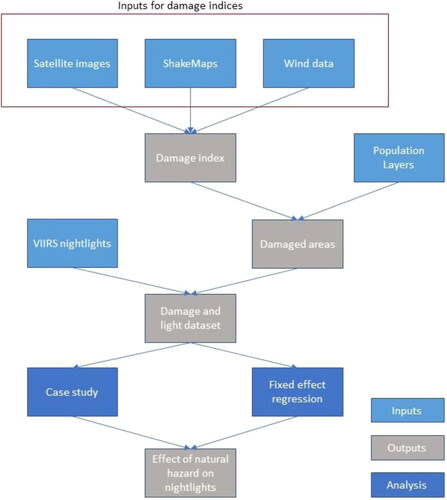
Figure 4. 2016 Aceh Earthquake – Mean of nightlight cell values in the province of Aceh split between cells that were affected by the earthquake and those that were not. Source: Authors’ estimates based on VIIRS and population layer data (see text for details).
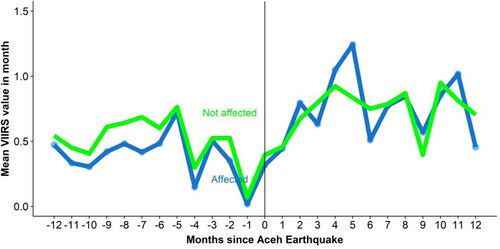
Figure 5. Case study of Typhoon Haiyan and Rammasun showing the mean VIIRS value for cells that were affected by typhoon Haiyan and those that were in the same province but that were not damaged. Source: Authors’ estimates based on VIIRS and population layer data (see text for details).
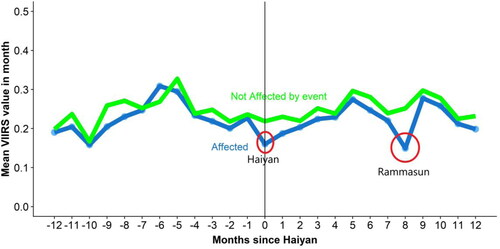
Figure 6. 2017 Southern Thailand Floods mean VIIRS nightlight values before and after for impacted and non-impacted cells. Source: Authors’ estimates based on VIIRS and population layer data (see text for details).
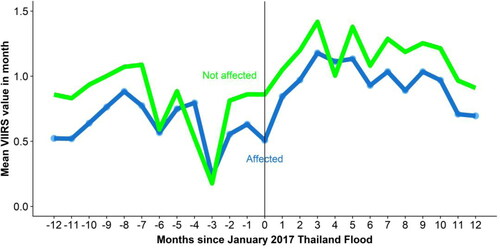
Figure 7. Earthquake coefficients with 95% confidence intervals. Source: Authors’ estimates based on VIIRS and population layer data (see text for details).
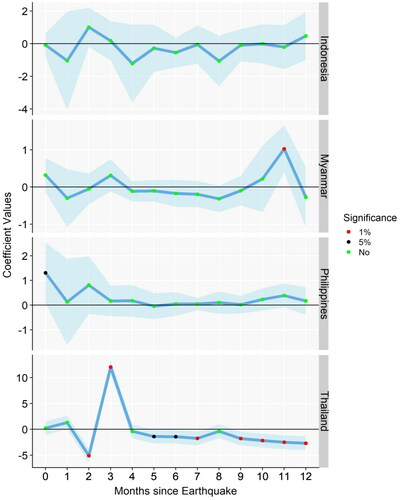
Figure 8. Typhoon coefficients with 95% confidence intervals. Source: Authors’ estimates based on VIIRS and population layer data (see text for details).
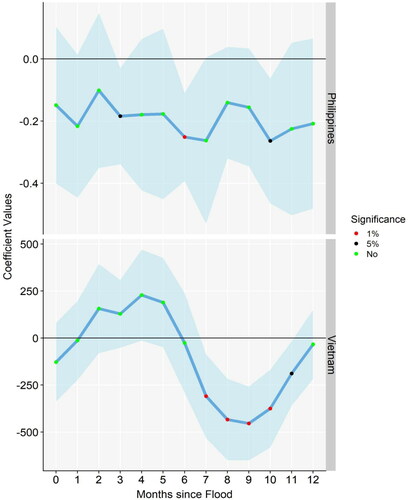
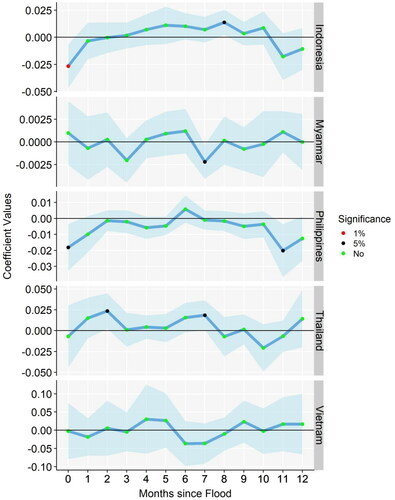
Figure 9. Flood coefficients with 95% confidence intervals. Source: Authors’ estimates based on VIIRS and population layer data (see text for details).
Data availability statement
The data used in this study were derived from the following resources available in the public domain:
These data were derived from the following resources available in the public domain:
Population data:
Worldpop: https://www.worldpop.org/project/categories?id=3
CIESIN: https://ciesin.columbia.edu/data/hrsl/
Nightlights data:
VIIRS: https://eogdata.mines.edu/download_dnb_composites.html
Natural hazards data:
Earthquakes:
USGS Shakemaps: https://earthquake.usgs.gov/earthquakes/search/
Building inventory data: https://pubs.er.usgs.gov/publication/ofr20081160
Typhoons:
IBTrACS: https://www.ncdc.noaa.gov/ibtracs/index.php?name=ib-v4-access
Floods:
TRMM 3B42RT: https://disc.gsfc.nasa.gov/datasets/TRMM_3B42RT_Daily_7/summary