Figures & data
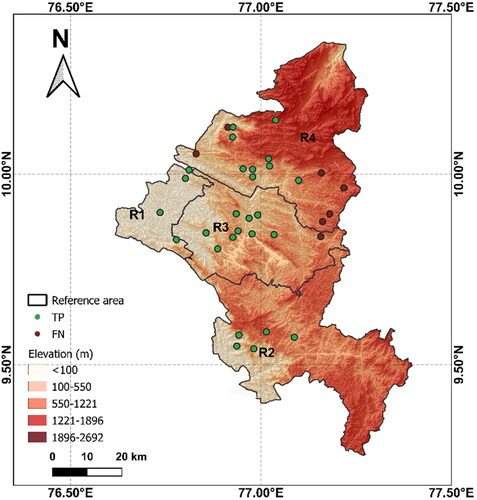
Figure 1. Location detains of Idukki (a) India (b) Geological map of Idukki district (modified after (Geological Survey of India Citation2010)).
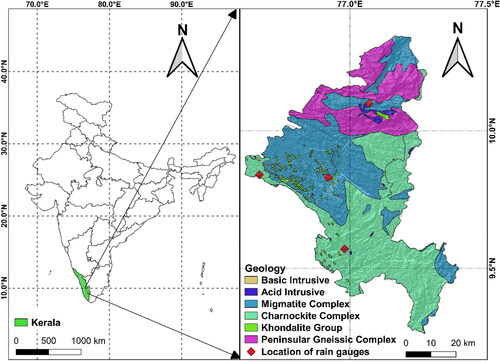
Figure 2. Location of rain gauges, landslides and reference areas considered for the analysis.
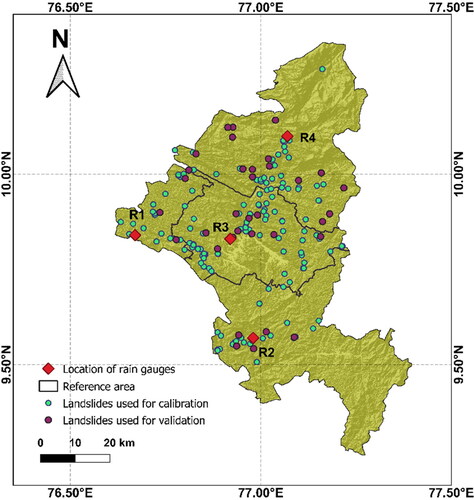
Figure 3. Annual and cumulative rainfall recorded in the four rain gauges during the study period.
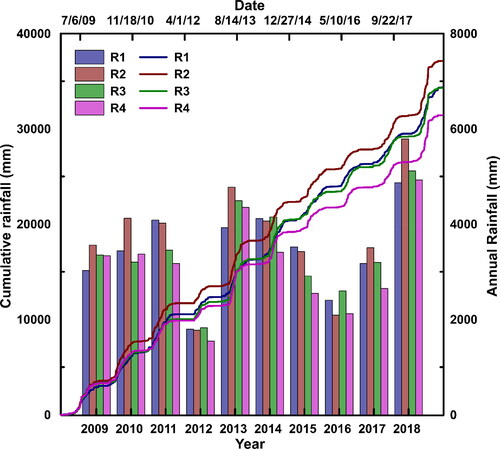
Figure 4. Data transformation using target function for Idukki.
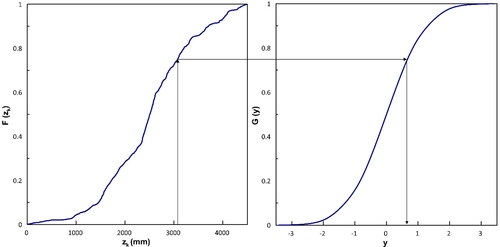
Figure 5. An example of threshold curves for cumulative rainfall up to 100 days; ‘’ is the standard deviation of each series.
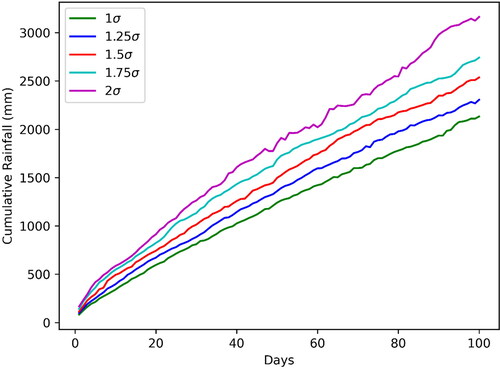
Figure 6. Decisional algorithm used for calibration.
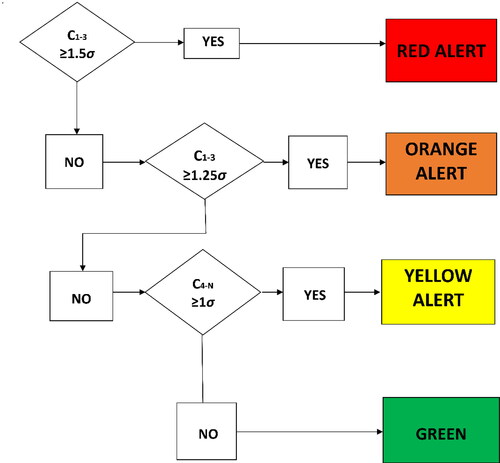
Figure 7. A graphical representation for the process of optimization for increasing the threshold value.
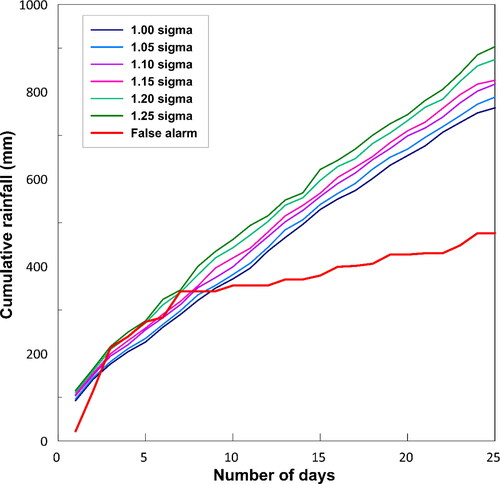
Table 1. Optimized threshold and N values for each reference area.
Figure 8. Number of false alarms before and after optimization.
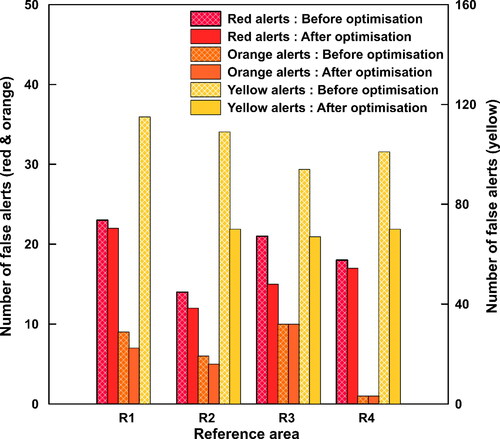
Table 2. Results of validation of SIGMA model for Idukki.
Figure 9. Correctly predicted landslides (TP) and missed landslides (FN) during validation.