
Figures & data
Table 1. Input variables considered in some existing studies of sea level prediction around East Asian sea.
Figure 1. Map of the Malaysia Sea showing Malacca strait and the locations of West Peninsular tide gauges. Source: Author.
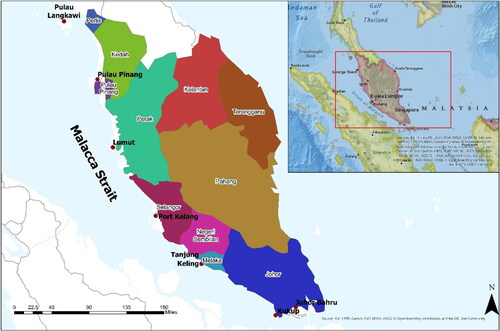
Figure 2. Elevation profile of West Peninsular Coastline.
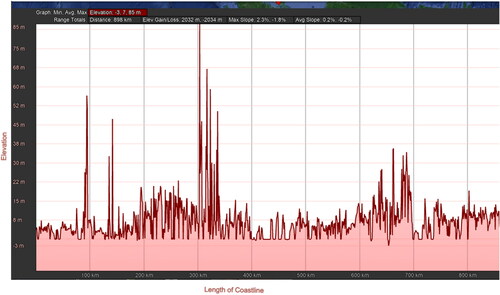
Table 2. Tide gauge stations at the West Peninsular Malaysia.
Figure 3. Heat Map of ocean-atmosphere variable correlation matrix for Johor Bahru.
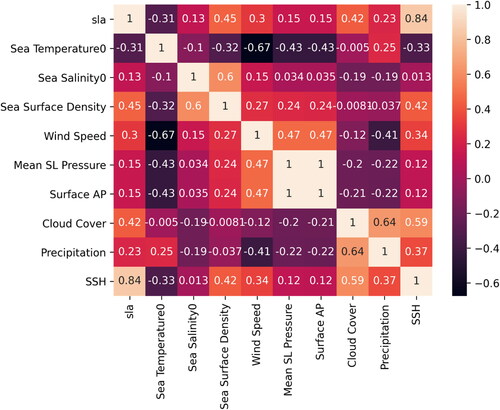
Table 3. Summary Statistics of the ocean-atmosphere variables for 7 stations in West Peninsular Malaysia.
Figure 4. Time series analysis plots for Johor Bahru showing (a) sea level decomposed into trends, seasonality and residuals. (b) rolling mean statistics (c) autocorrelation (d) Partial autocorrelation.
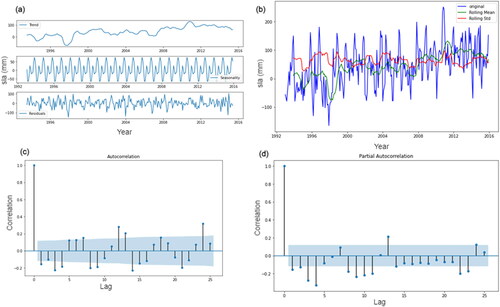
Figure 5. Heat map of ocean-atmosphere correlation for Johor Bahru (a) and Lumut (b).
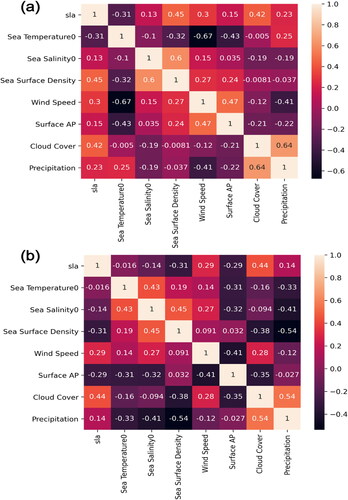
Table 4. Correlation of ocean-atmospheric variables with sea level.
Table 5. R accuracy of ARIMA, SVR and LSTM models for different scenarios at all station.
Figure 6. Relative SLA pattern for North West Peninsular.
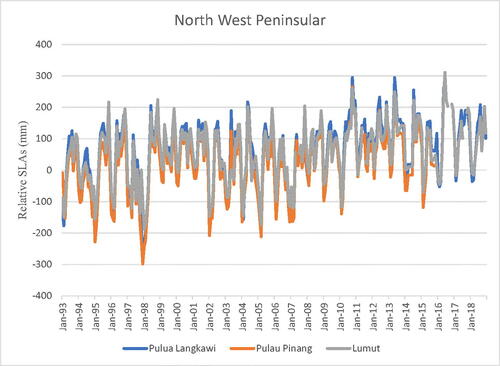
Figure 7. Relative SLA pattern for West Central Peninsular.
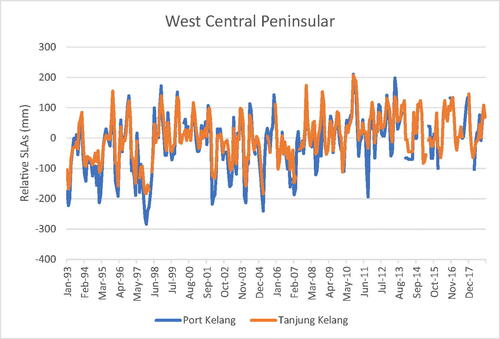
Figure 8. Relative SLA pattern for South West Peninsular.
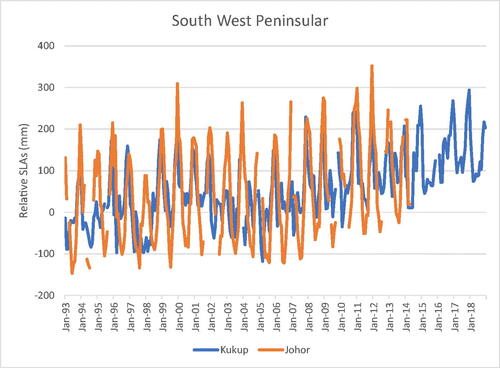
Table 6. Relative Sea Level Trend of the seven tide gauge stations at West Peninsular.