
Figures & data
Figure 1. People affected by floods in Sudan (OCHA Citation2019, 2020).
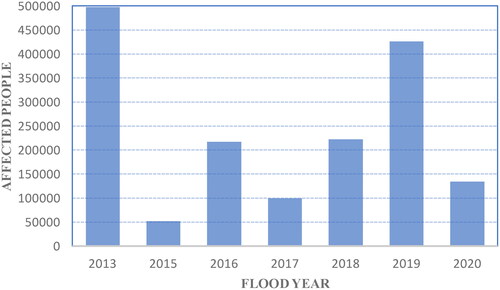
Figure 2. Study area and flood disasters effectiveness.
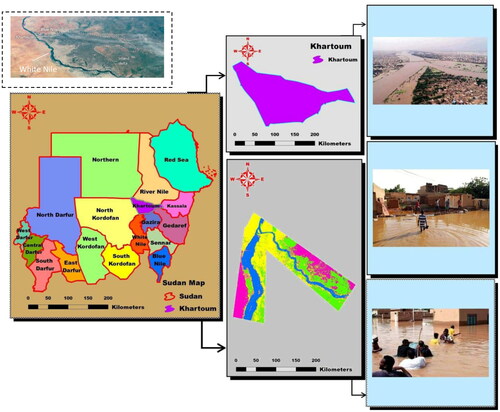
Table 1. Landsat-8 images used in this study.
Figure 3. Flow direction in the selected pour point model.
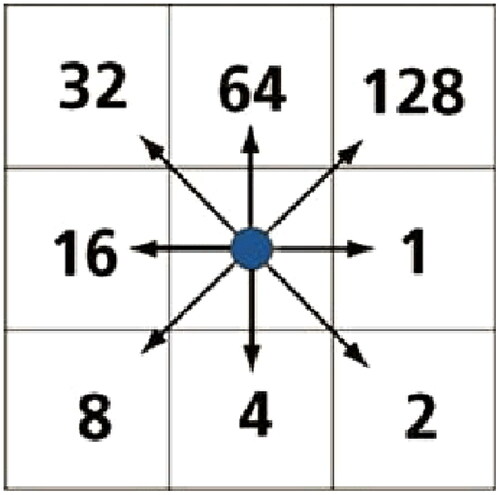
Figure 4. Flowchart of flood delineation.
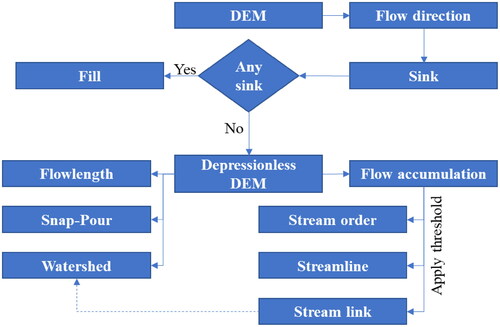
Figure 5. LULC of study areas for 2014, 2016 and 2020 for the (left) BN and (right) WN.
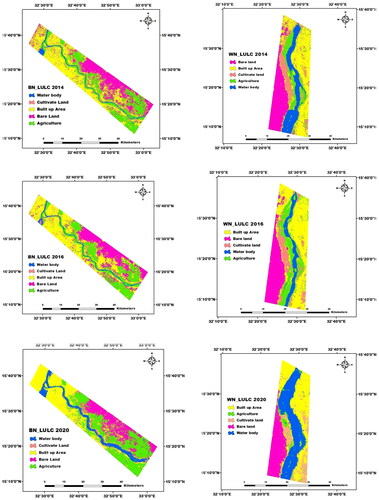
Table 2. LULC changes around BN.
Table 3. LULC changes around WN.
Figure 6. NDVI of study areas for (left) the BN and (right) the WN.
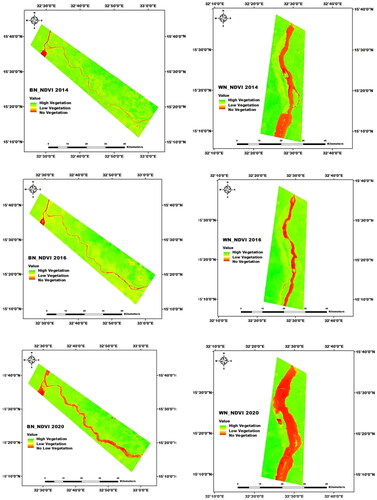
Figure 7. NDWI of study areas for the (left) BN and (right) WN.
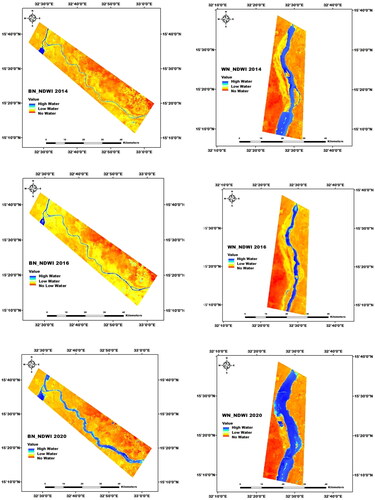
Figure 8. Transition land use around (upper) BN and (lower) WN in between 2014 and 2016.
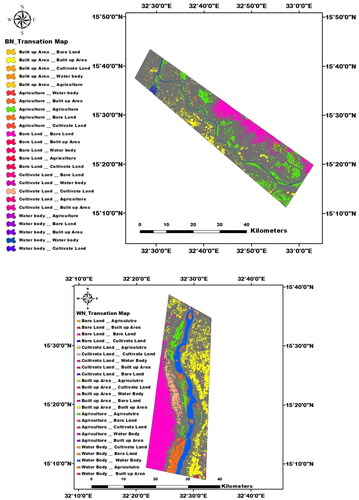
Table 4. Gain and loss of BN transition probability matrix for period 2014–2016.
Table 5. Gain and loss of BN transition probability matrix for period 2016–2020.
Table 6. Gain and loss of WN transition probability matrix for period 2014–2016.
Table 7. Gain and loss of WN transition probability matrix for period 2016–2020.
Figure 9. Prediction map of land change around (left) BN and (right) WN.
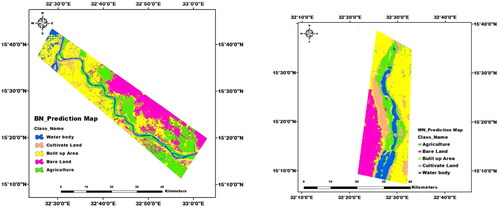
Figure 10. Land-use change during 2014, 2016, 2020 and the predictive period 2024 for (a) BN and (b) WN.
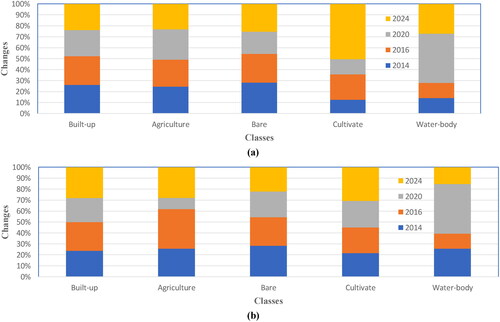
Table 8. Predictive are changes around BN and WN for 2024.
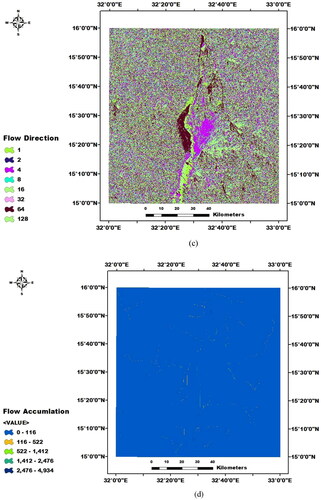
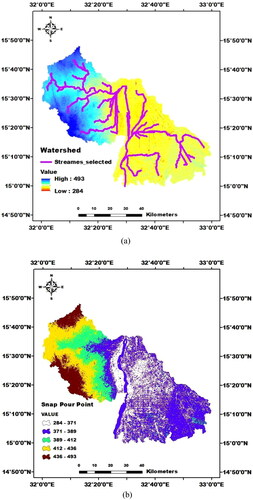
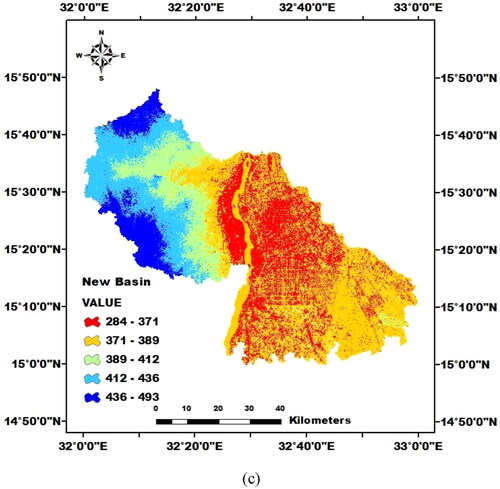
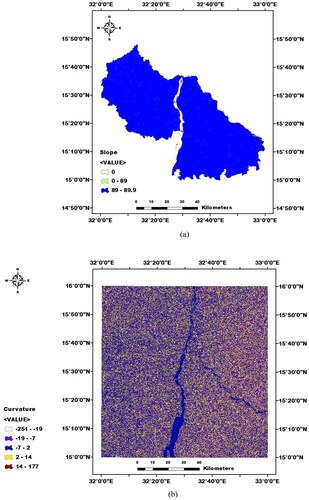
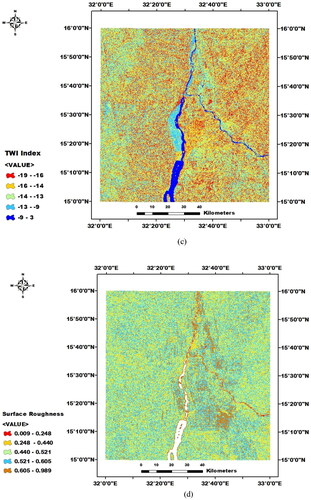
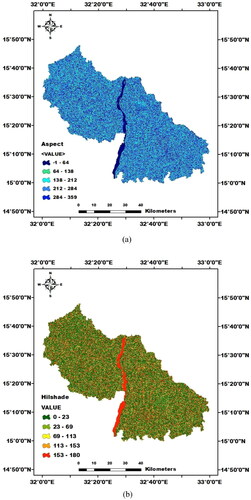
Figure 14. Factors of flood sensitivity for the (upper) aspect and (lower) hillshed.
Data availability statement
The data that support the findings of this study are openly available in [USGS EROS Center] at https://www.usgs.gov/centers/eros.