
Figures & data
Table 1. List of weather stations in Pakistan.
Figure 1. (a) Spatial rainfall distribution map of Pakistan (1981-2017), (b) Anomalous precipitation patterns in Pakistan (1981–2017).
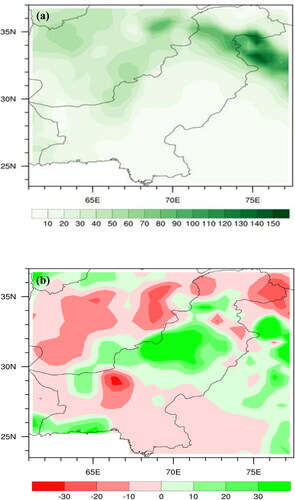
Figure 2. Pakistan's standardized total rainfall for June-August from 1981 to 2017. The solid blue line represents 11-year running mean.
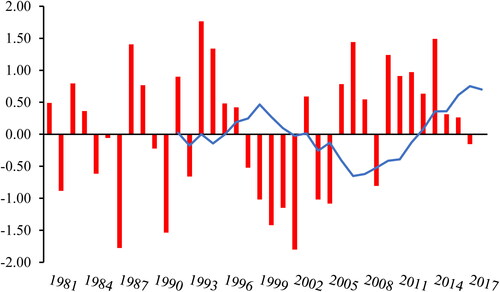
Table 2. Standard Single Z-Index criteria for categorizing years based on the severity of floods or droughts.
Figure 3. (a) Time series of the SPI and Single Z-Index on Pakistan's rainfall. (b) Scatter diagram of the SPI and Z score for Pakistan's rainfall (1981-2017). Positive values indicate wetter than normal, negative values drier than normal.
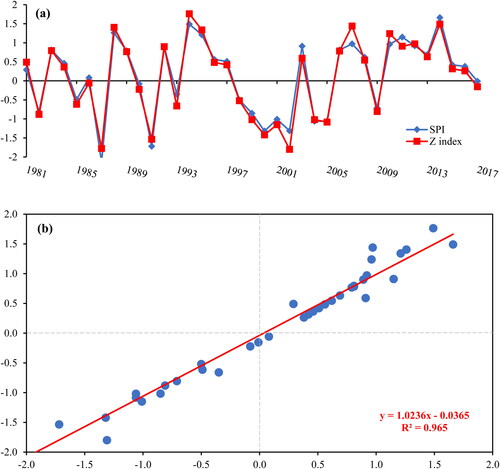
Table 3. Grading of 1981 – 2017 period into flood, normal and drought years based on Pakistan's average summer rainfall and their probabilities.
Table 4. Correlation coefficients of Pakistan JJA composite droughts and selected meteorological parameters. The correlations are significant at 95%confidence level. All the values with asterisks are considered to be significant at 95% confidence interval. Shaded cells are chosen for further analysis.
Figure 4. January to March (JFM) 2 m air temperature anomaly for composite drought years (units: °C).
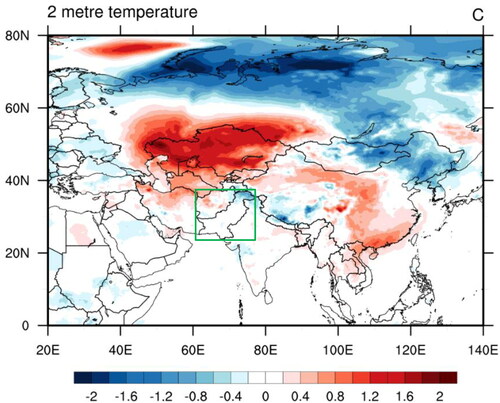
Figure 5. January to March (JFM) mean sea level pressure anomaly for composite drought years (units: Pa).
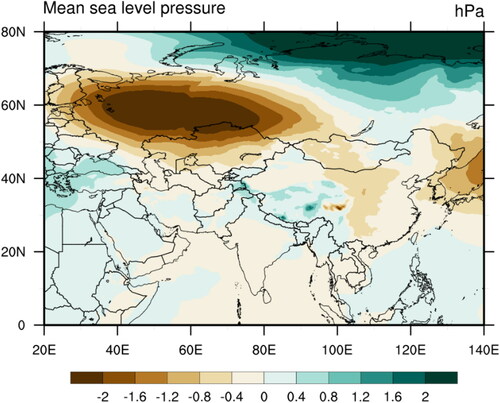
Figure 6. October to December (OND) mean sea level pressure anomaly for composite drought years (units: °C).
Figure 7. January to March (JFM) geopotential height anomalies at 500 hPa (a) and 300 hPa (b) for composite drought years (units: gpm).
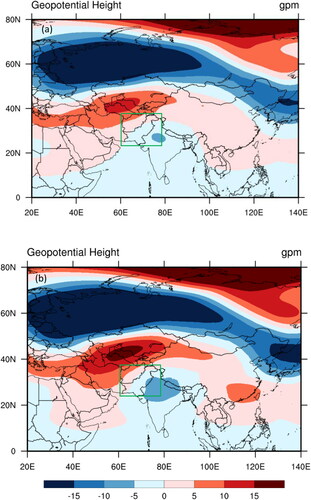
Figure 8. March to May (MAM) wind vector anomalies at 500 hPa (a) and 300 hPa (b) for composite drought years (units: m2 s-2).
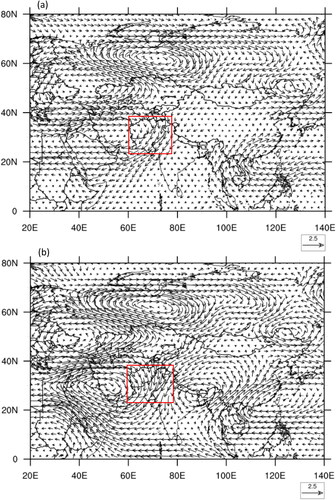
Figure 9. Hot and dry extremes over Pakistan during the core monsoon season (JJA) and associated links with the ENSO during 1981-2017. (a) Three-month (June to August) precipitation anomalies, (b) the single Z-index anomalies, (c) Nino 3.4 SST anomalies during the same time period. Grey vertical bars denote the dry monsoon anomalies associated with the 6 most severe and extreme drought years.
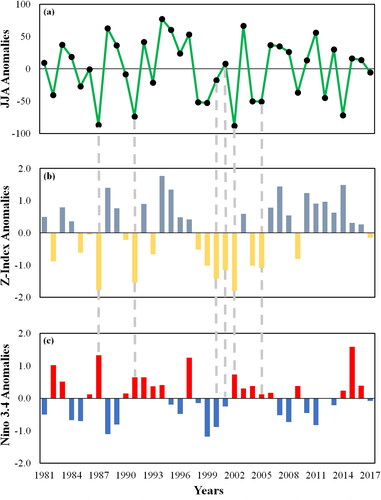
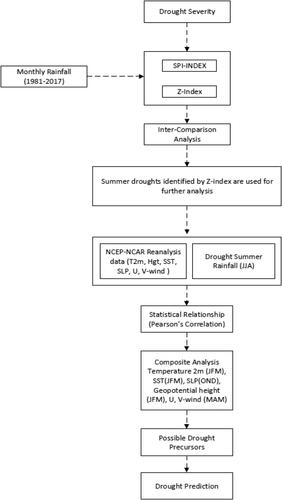
Figure 10. Schematic diagram of drought severity assessment and drought prediction.
Data availability statement
The monthly reanalysis data sets that support the findings of this study are publically availabl at: https://www.ecmwf.int/en/forecasts/datasets/reanalysis-datasets/era5
The station data was obtained from Pakista meterological department https://www.pmd.gov.pk/en/