
Figures & data
Figure 1. Location of the study area; (a) Iraq, (b) the borders of the two provinces in northern Iraq including train and test points, (c) the experimental area, (d) the experimental and test area including 20 test points (5.6 km2).
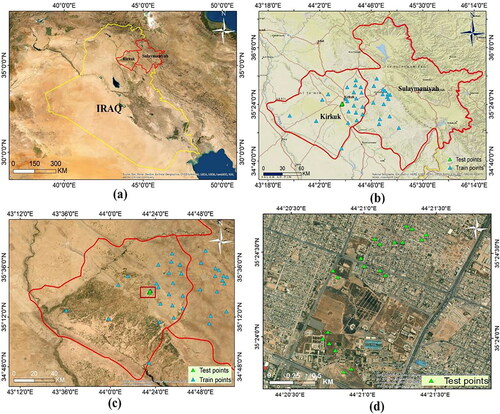
Figure 2. The procedures employed in the research.
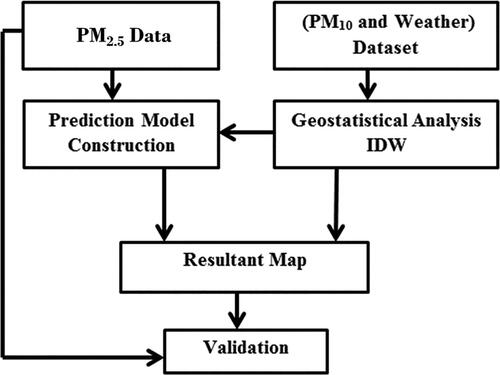
Figure 3. The air quality multimeter.
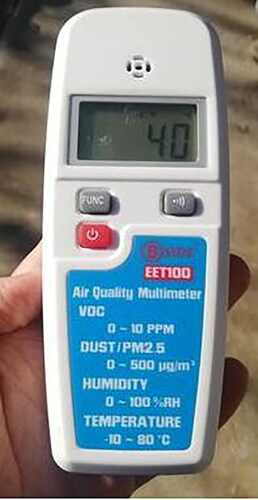
Table 1. Daily PM2.5 and PM10 levels μg/m3 (U.S. Environmental Protection Agency).
Figure 4. IDW outputs of July 2019 datasets for (a) PM2.5, (b) PM10, (c) Temperature, (d) Humidity, (e) Wind.
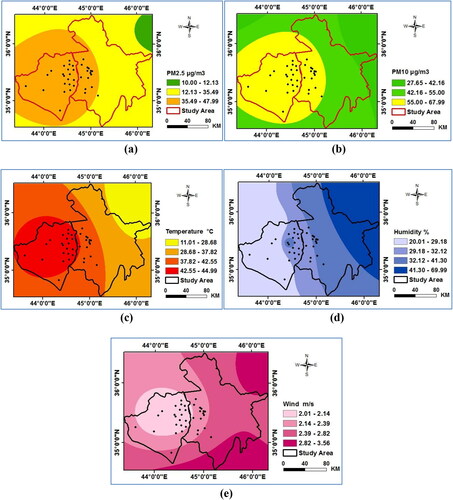
Figure 5. The PM2.5 distribution map based on the MODIS image.
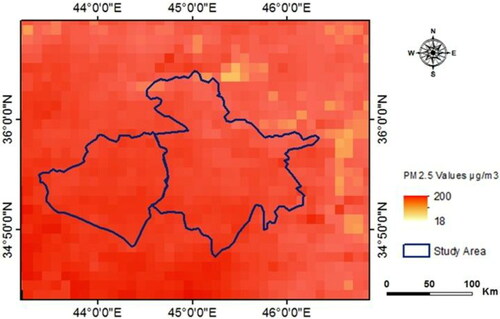
Table 2. Regression outputs of July 2019 dataset.
Table 3. Regression outputs of February 2020 dataset.
Figure 6. (a) Prediction map of PM2.5 in Kirkuk and Sulaymaniyah provinces of July 2019. (b) Prediction map in Kirkuk at an area of 5.6 km2 of July 2019. (c) Prediction map in Kirkuk at an area of 5.6 km2 of February 2020.
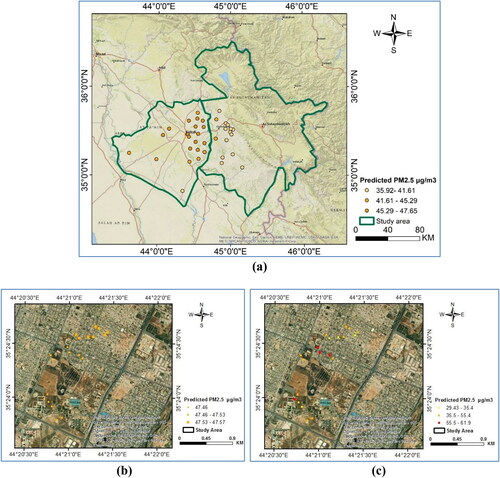
Figure 7. PM2.5 cross-validation, (a) Predication validation at 5.6 km2 of July 2019, (b) Predication validation north of Iraq of July 2019, (c) Predication validation at 5.6 km2 of February 2020.
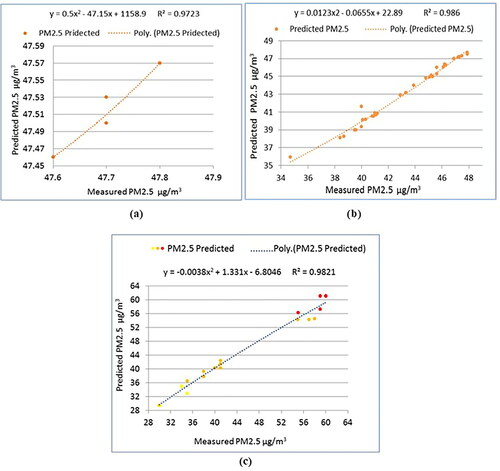
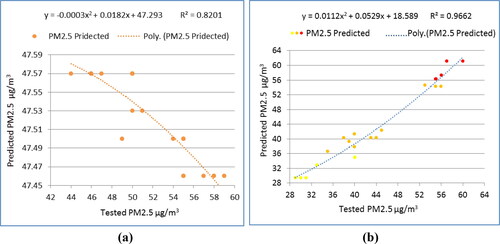
Figure 8. Model-validation in Kirkuk at 5.6 km2 of; (a) July 2019 (b) February 2020.
Data availability statement
The data that support the findings of this study are available from the corresponding author, Bahareh Kalantar, upon reasonable request.