
Figures & data
Table 1. Literature review of the parameters used to depict flood hazard zones (FHZ).
Figure 1. Study site.
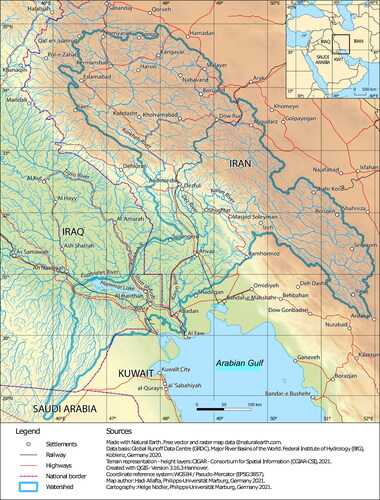
Figure 2. Flowchart for the identification of flood hazard zones (FHZs).
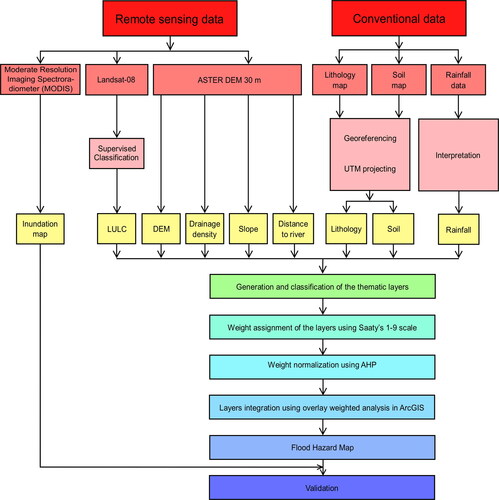
Table 2. The 1–9 scale of factors importance (Saaty Citation1980a).
Table 3. A (8 x× 8) pairwise comparison matrix for the AHP-based flood hazard mapping.
Table 4. Calculation of the principal Eigenvalue (λmax) to rank parameter influence.
Table 5. Saaty's ratio index for different n values (Saaty Citation1980a).
Table 6. Assigned weight and rank scores for the layer/class of the Shatt Al-Arab basin.
Figure 3. The study area’s (a) annual rainfall, (b) distance to rivers, (c) Digital Elevation Model (DEM), and (d) Slope.
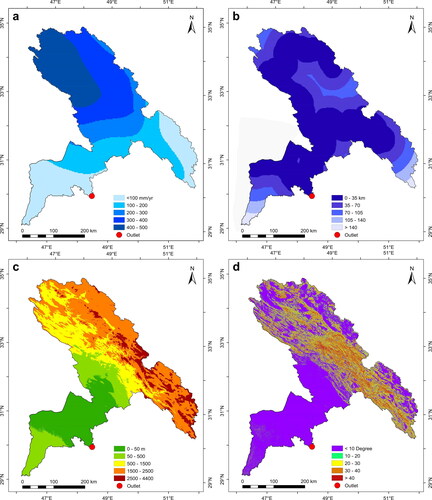
Figure 4. The study area’s (a) LULC, (b) drainage density, (c) soils (dominant grain sizes), and (d) Lithology.
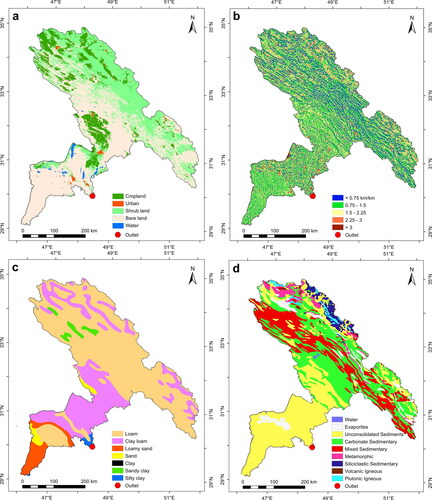
Figure 5. Flood hazard map of the Shatt Al-Arab basin.
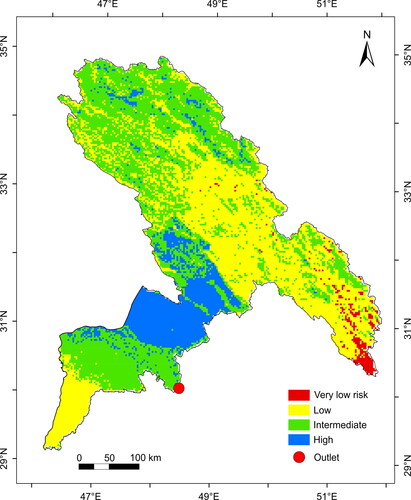
Figure 6. Flood hazard zones validation against the 21 March 2019 flood event.
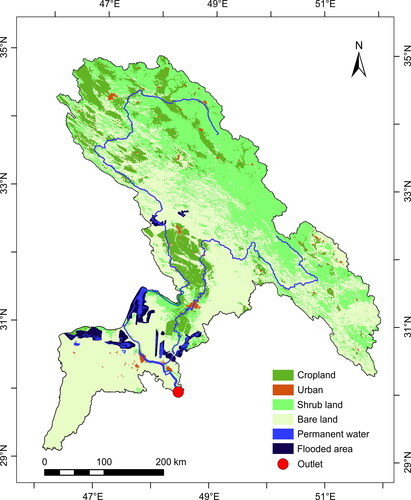
Table 7. Flood hazard zones distribution for each land use category.
Data availability statement
The authors confirm that the data supporting the findings of this study are available within the article.