
Figures & data
Figure 1. Three-dimensional model of the Xiadian Gold Mine.
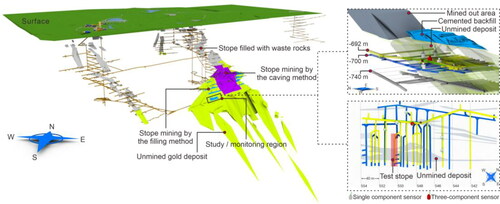
Figure 2. Three common types of signals recorded in MS monitoring system: (a) MS signal, (b) blasting signal, and (c) mechanical signal.
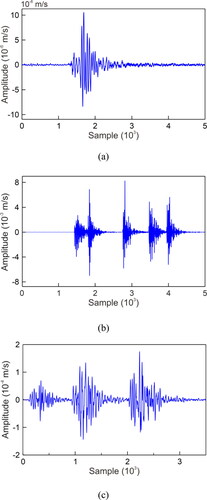
Figure 3. Histogram of characteristic parameters of three kinds of signals: (a) dominant frequency, (b) number of peaks and (c) maximum amplitude.
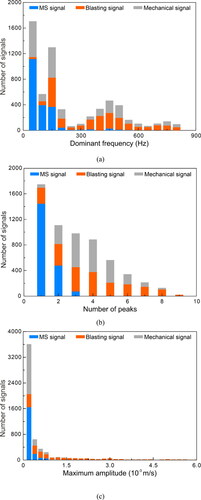
Figure 4. The typical network structure of the CNN.
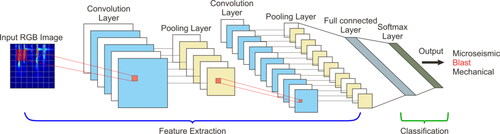
Figure 5. Schematic diagram of the convolution operation. The left panel shows the feature map before convolution operation, and the right panel shows the feature map after convolution operation.
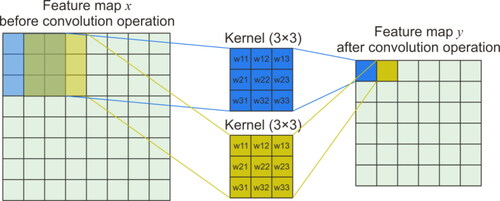
Figure 6. The implementation process of the Softmax layer.
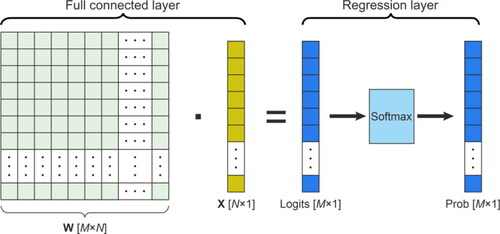
Figure 7. LSTM units and connection mode of forge gate, input gate and output gate.
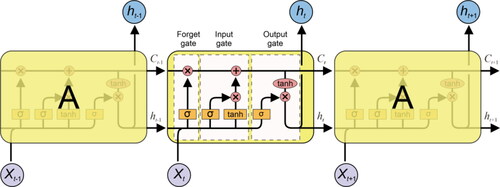
Figure 8. The structure of CNN-LSTM hybrid networks. MS, M, and BL stand for MS signal, mechanical signal, and blasting signal, respectively.
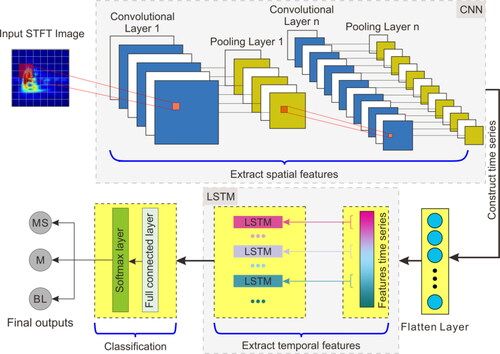
Figure 9. The flow chart of the SSA-CNN-LSTM hybrid networks: (a) data pre-processing, (b) extract RC of signals by SSA method, (c) build signal recognition hybrid networks, and (d) test the signal recognition performance.
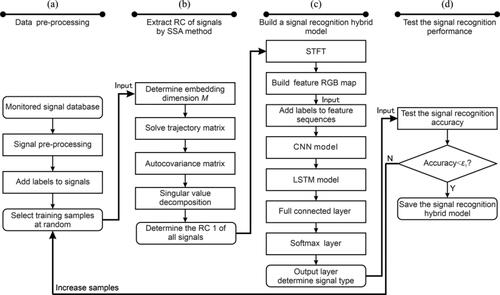
Figure 10. SSA analysis process of the MS signal with severe noise: (a) original MS signal, (b) RC 1–RC 6, (c) energy ratio of RCs to the original MS signal, and (d) comparison of RC 1 and original MS signal.
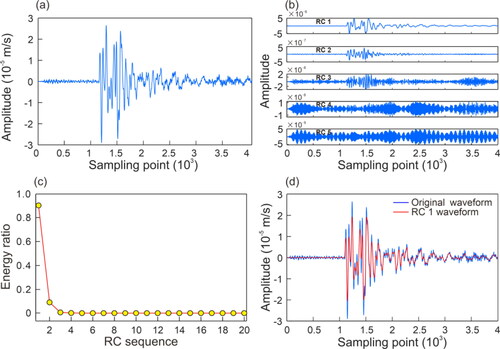
Figure 11. Energy ratio of each RC of 30 MS signals. 1 to 8 in the horizontal axis represent the first to eighth RC of the MS signal.
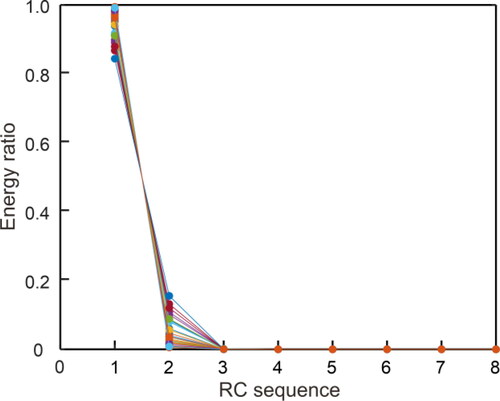
Figure 12. Time-frequency amplitude diagrams of three typical monitoring signals before and after tht SSA processing: (a) MS signal, (b) blasting signal, and (c) mechanical signal.
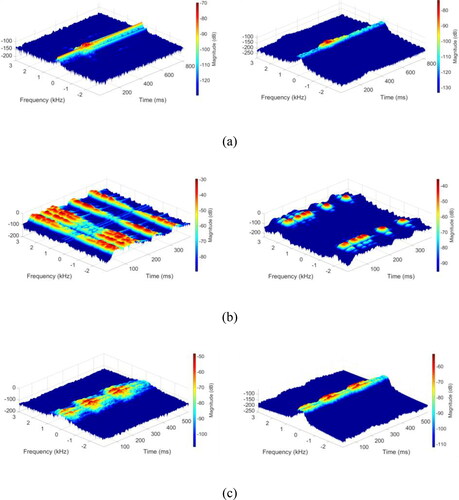
Figure 13. The network structure of the proposed CNN-LSTM hybrid model.
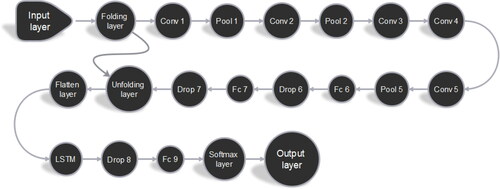
Table 1. The network structure of the SSA-CNN-LSTM hybrid networks model.
Figure 14. The rise time of three kinds of signals.
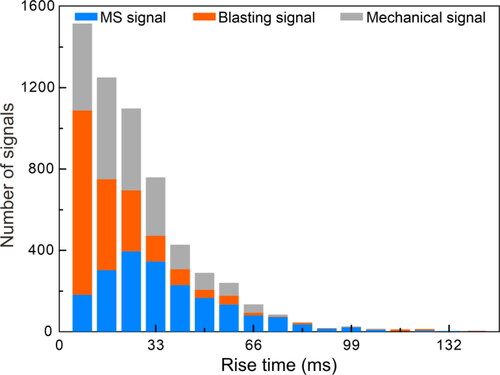
Figure 15. Confusion matrices of recognition results of four commonly used methods: (a) SVM, (b) KNN, (c) DT, (d) LDA. MS, M, and BL stand for MS signal, mechanical signal, and blasting signal.
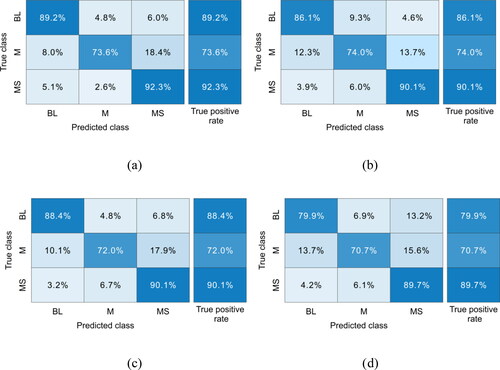
Table 2. Signal recognition accuracy for four conventional methods using 5-fold cross-validation.
Table 3. Signal recognition accuracy for four neural network methods using 5-fold cross-validation.
Figure 16. Confusion matrices of recognition results of four neural network methods: (a) SSA-CNN-LSTM, (b) CNN, (c) LSTM, and (d) BP.
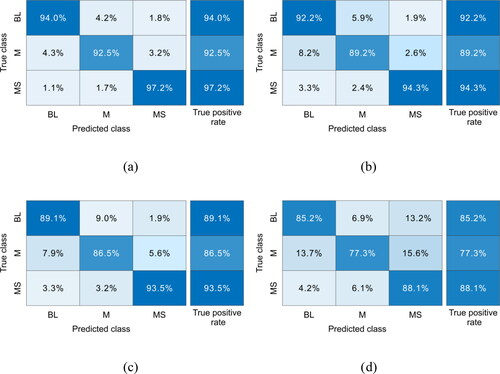
Figure 17. Comparison of signal recognition accuracy of eight methods.
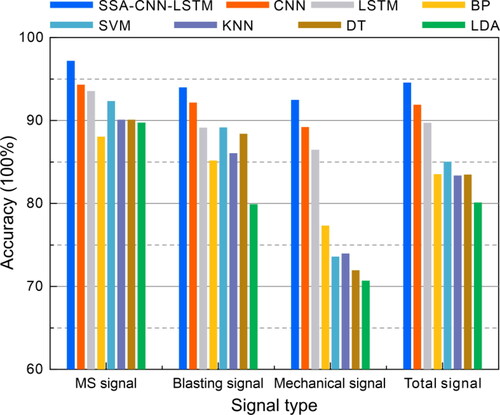
Figure A1. The total performance of each distribution with and without over-sampling from and . ID 1 shows no result after oversampling since it was already balanced.
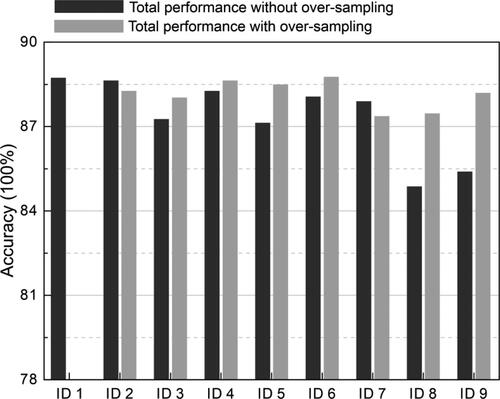
Table A1. Nine distributions of 6000 signals for researching on the impact of imbalanced training data for the SSA-CNN-LSTM model.
Table A2. Nine distributions of 3000 signals for researching on the impact of imbalanced training data for the SSA-CNN-LSTM model.
Table A3. The total and the individual recognition accuracies (the total number of samples is 6000).
Table A4. The total and the individual recognition accuracies (the total number of samples is 3000).
Table A5. The total and the individual recognition accuracies with oversampling (the total number of samples is 3000).
Data availability statement
The data that support the finding of this study are available from the corresponding author upon reasonable request.