
Figures & data
Figure 1. Framework for mapping multi-hazard risk of coupling of natural and technological hazards.
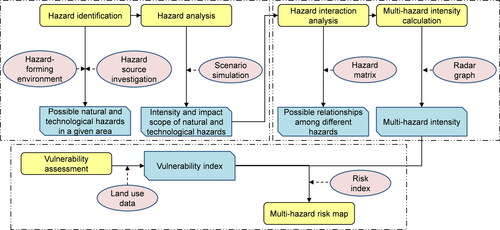
Figure 2. Hazard matrix for triggered relationships among different hazards.
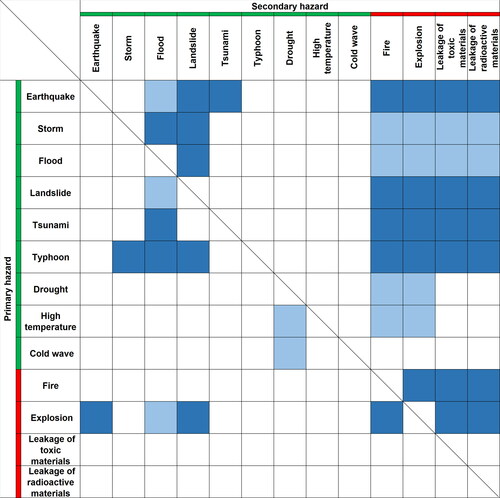
Figure 3. Radar graph for multi-hazard intensity calculation. A) Initial intensity degree, B) Adjusted intensity degree.
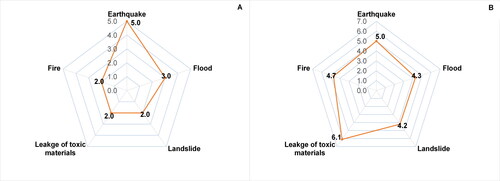
Table 1. Adjustment principle for hazard intensity.
Table 2. Classification of vulnerability degree.
Figure 4. HSC, Beijing.
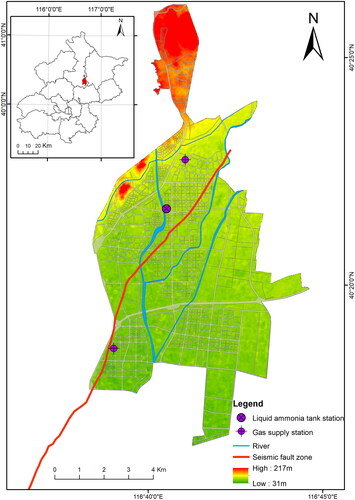
Figure 5. Intensity degree of earthquake (A), flood (B), landslide (C).
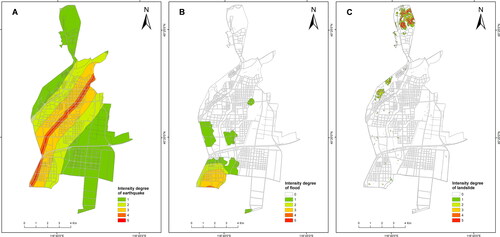
Table 3. Dividing standard for intensity degree of earthquake, flood and landslide.
Table 4. Dividing standard for intensity degree of explosion.
Table 5. Dividing standard for intensity degree of liquid ammonia leakage.
Figure 6. Hazard interaction types in HSC.
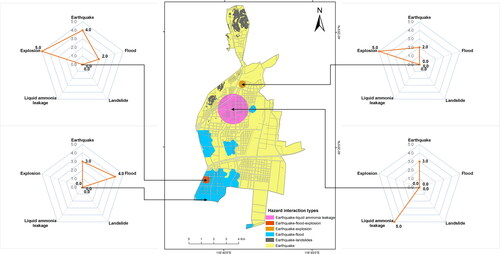
Figure 7. Multi-hazard intensity in HSC.
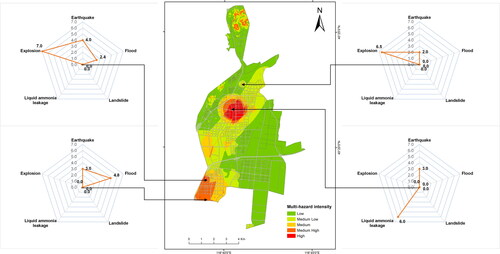
Figure 8. Vulnerability index in HSC.
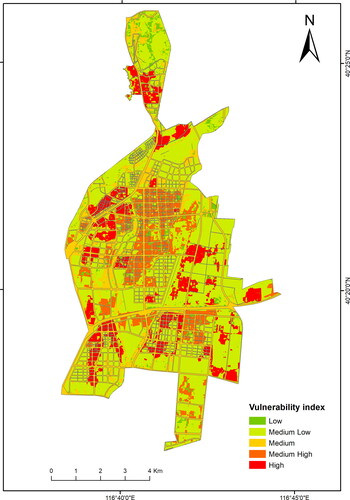
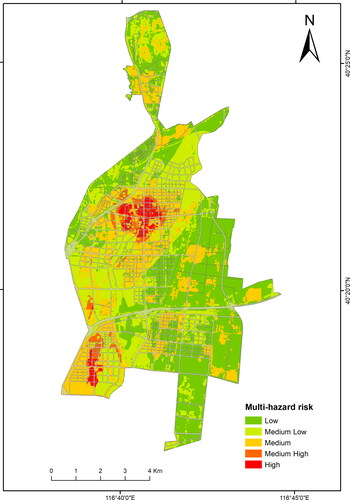
Figure 9. Multi-hazard risk map in HSC.
Data availability statement
Hydrologic data were collected from local hydrological stations in Huairou, and seismic data were collected from China Earthquake Administration. Technological hazard data were generated at Beijing Emergency Management Bureau. Landsat TM/ETM remote sensing image were obtained from Resource and Environmental Science and Data Center (https://www.resdc.cn/data.aspx?DATAID=184). Derived data supporting the findings of this study are available from the corresponding author [J.F] on request.