
Figures & data
Figure 1. Location of Xiamen City.
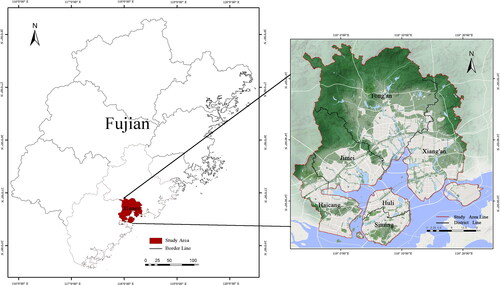
Table 1. Data types, accuracy, and source.
Figure 2. Conceptualization of UHV.
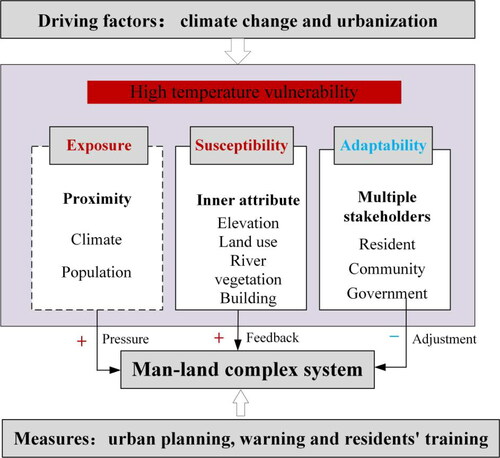
Table 2. Evaluation index system of UHV.
Table 3. Types, number, weight, and service radius of summer facilities.
Figure 3. Compound process of UHV based on BPNN model.
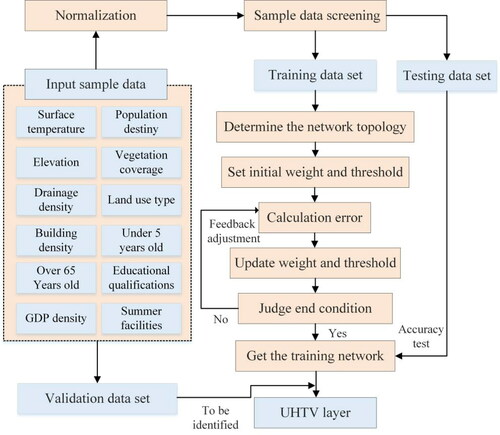
Figure 4. Spatial distribution of 12 indicators of UHV.
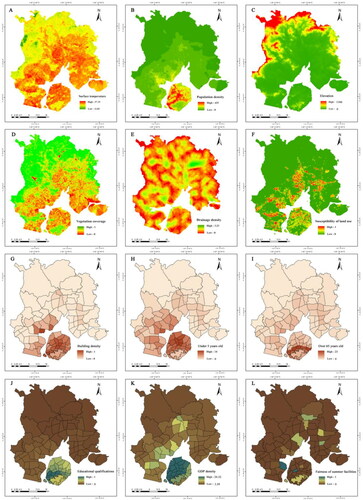
Figure 5. R value of training results.
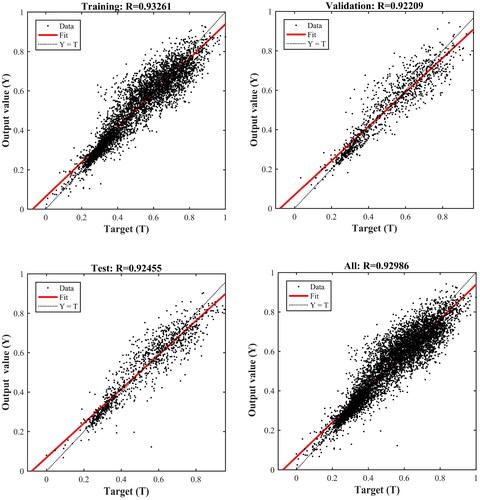
Figure 6. Spatial distribution of UHV.
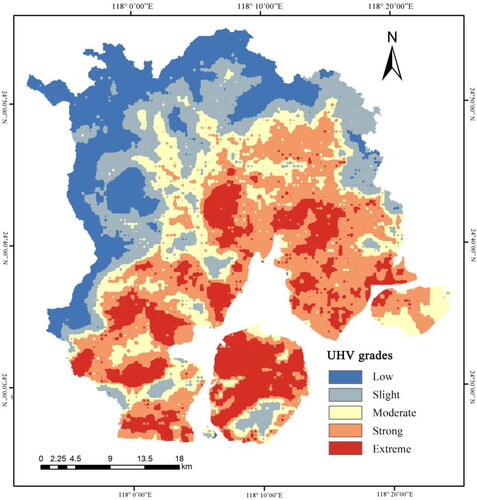
Table 4. District statistics of UHV (km2, %).
Figure 7. Hot spot analysis of UHV.
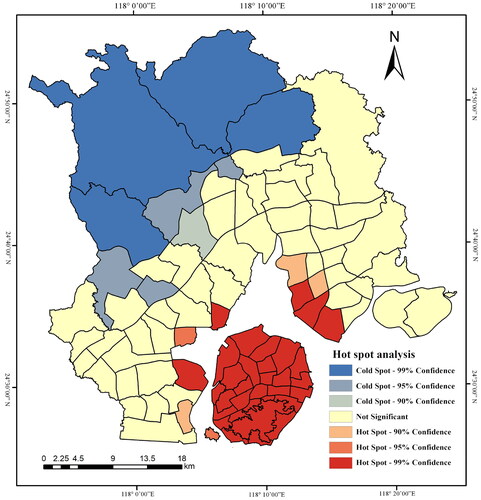
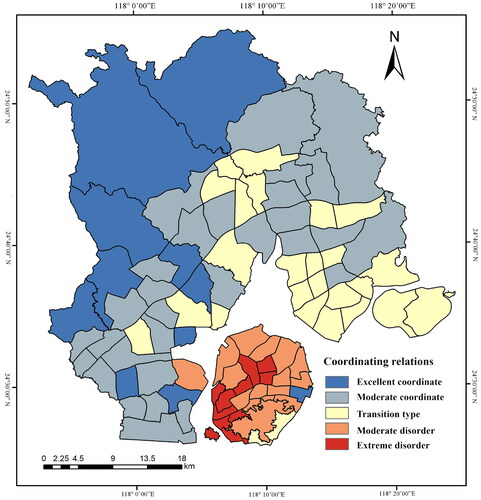
Figure 8. Coordinating relations of UHV.
Data availability statement
The data that support the findings of this study are available on request from the corresponding author, Yang HF.