
Figures & data
Figure 1. Study area, the NCR of India. Source: Author.
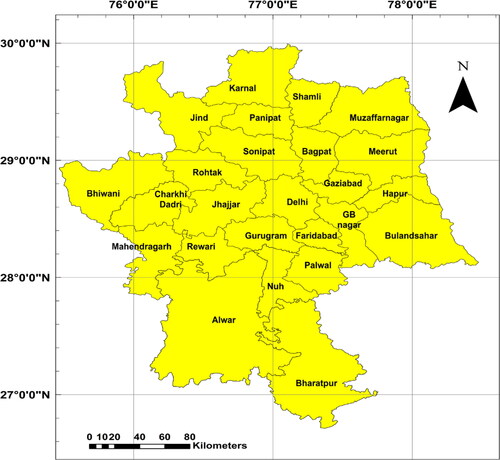
Figure 2. Seismotectonic map of the study area. Source: Author.
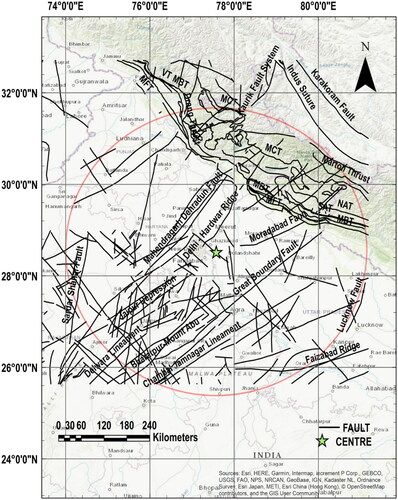
Figure 3. Study area showing (a) the faults, and (b) earthquake events from 1802 to 2020.
Source: Author.
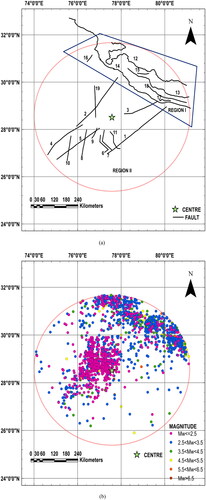
Figure 4. Linear regression relation (a) between ML and MS, and (b) between MW and ML. Source: Author.
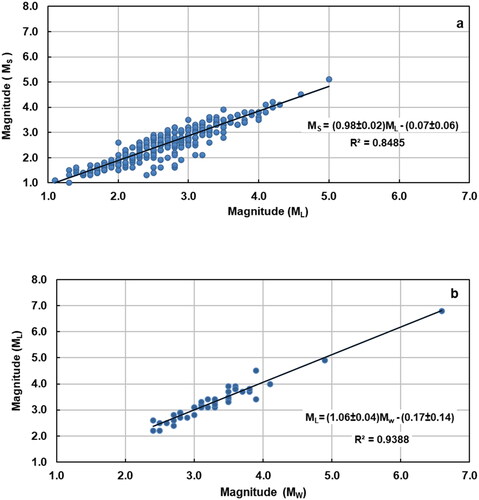
Figure 5. A map of the control region showing 1944 mutually exclusive seismic events.Source: Author.
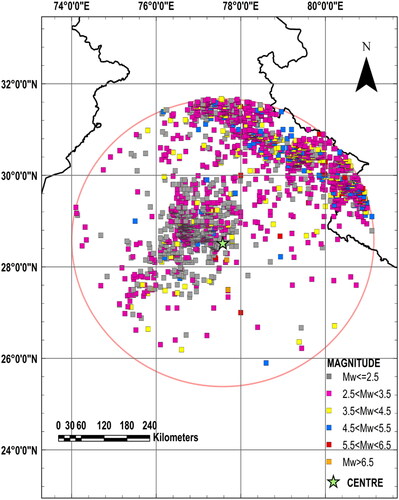
Figure 6. Check for the completeness of seismic data for (a) Region I, and (b) Region II. Source: Author.
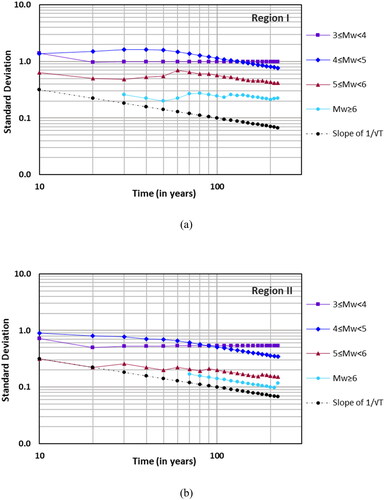
Table 1. Completeness of homogeneous earthquake catalogue with respect to time.
Table 2. List of calculated seismic parameters and its comparison with reported values for the region.
Figure 7. Estimation of Mc, a, and b parameters for (a) Region I, and (b) Region II. Source: Author.

Figure 8. Gutenberg - Richter relation for the Region I and II. Source: Author.
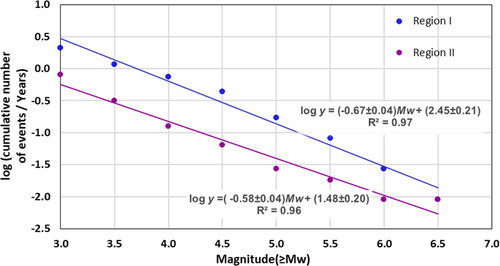
Figure 9. Earthquakes associated with each fault. Source: Author.
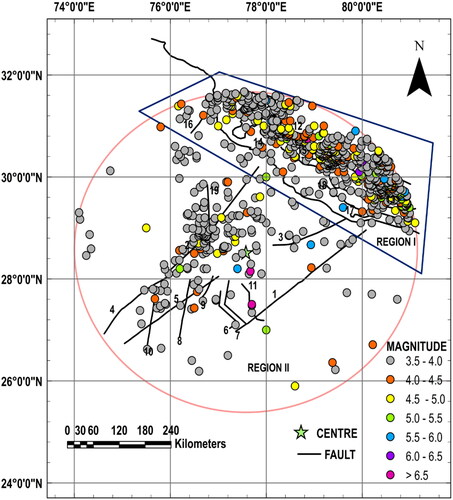
Table 3. Deaggregation of faults.
Figure 10. Fault level recurrence relation for (a) Region I, and (b) Region II. Source: Author.
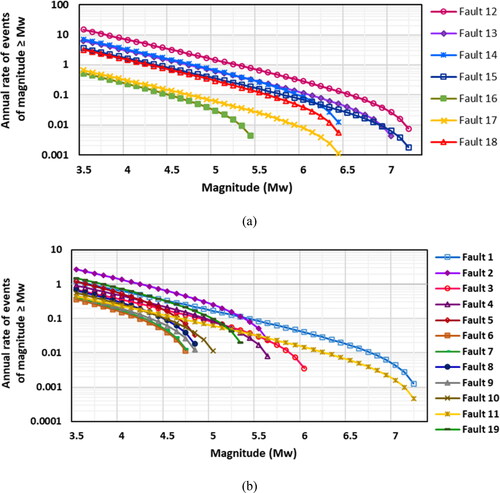
Figure 11. Grids used for PSHA in the NCR of India. Source: Author.
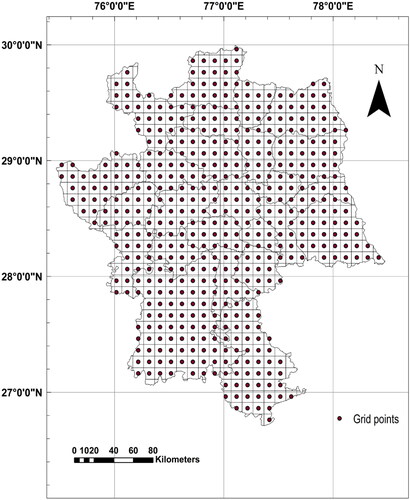
Figure 12. PGA vs. Hypocentral distance for Mw 7.0. Source: Author.
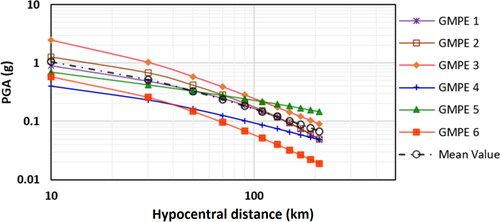
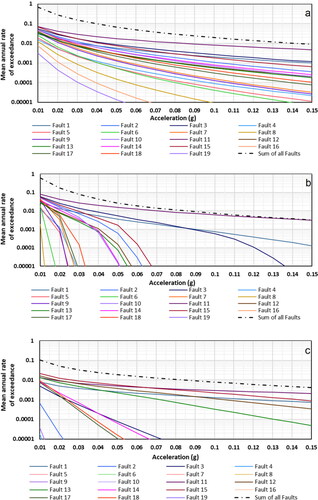
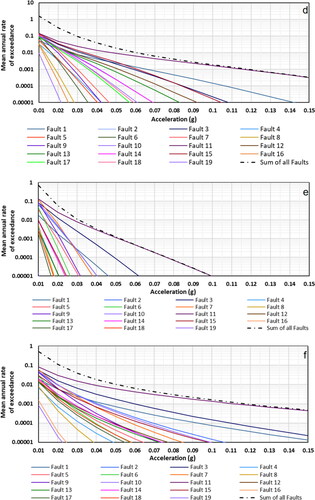
Figure 14. PGA at rock level for (a) 2% probability of exceedance in 50 years, (b) 2% probability of exceedance in 100 years, (c) 10% probability of exceedance in 50 years, and (d) 10% probability of exceedance in 100 years. Source: Author.
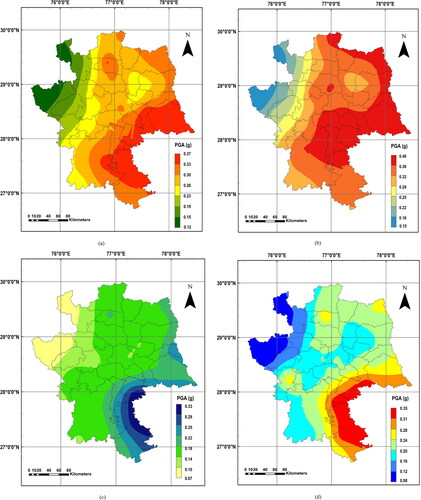
Table 4. Comparison of PGA values estimated in the present study with past results.
Data availability statement
The authors confirm that some portion of the data supporting the findings of this study is available within the article. Some of the raw data were generated at our laboratory and derived data supporting the findings of this study are available from the corresponding author [J.D.], upon reasonable request.