
Figures & data
Table 1. The example of emotion words with sentiments.
Figure 1. Geographic heat map of Sina Weibo flood-related posts.
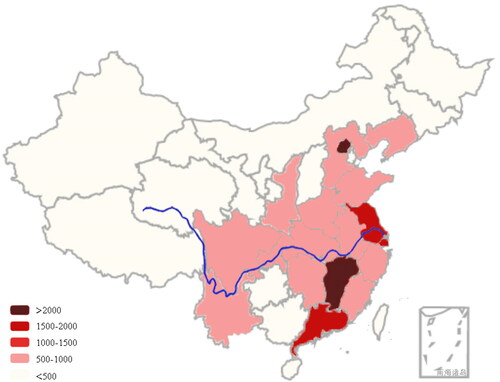
Figure 2. The proportions of text with three sentiments in different regions.
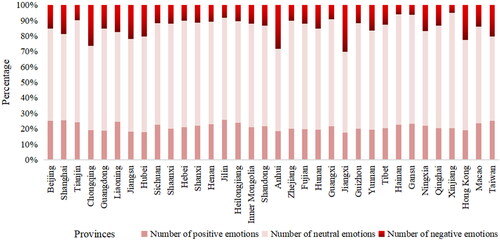
Table 2. LDA analysis of texts with negative sentiment in affected and non-affected regions.
Data availability statement
The data that support the findings of this study are available from the corresponding author, Hao Gao, upon reasonable request.